I have used printf debugging before and since then I always seem to be able to resolve bugs faster this way.
There are situations where better tools are needed, and here are some of the best ones that I'm sure you'll find useful:
1. debugger;
You can use the "debugger;" statement to add forced breakpoints to your code.
Do you need a breakpoint condition? Just wrap it in an IF clause:
Just remember to remove before going live.
2. Disconnect when the node changes
Sometimes the DOM seems to have a mind of its own. It can be difficult to find the source of the problem when incredible changes occur.
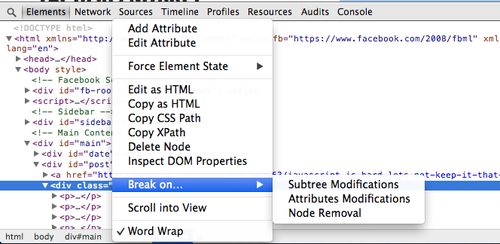
Chrome developers have super useful skills for debugging this issue. This is called "Break on..." and you can find it by right-clicking on the DOM node on the Elements tab.
Breakpoints can be set after a node is deleted, when a node's properties change, or when nodes in its subtree change.

3. Ajax breakpoint
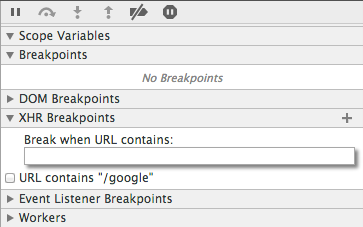
XHR breakpoints, or Ajax breakpoints as I call them, also allow breaking when an expected Ajax request is made.
This is an amazing tool when debugging your web application's network.

4. Simulate different mobile devices
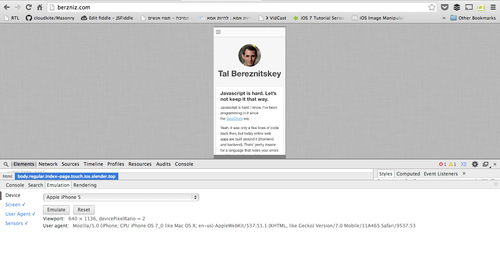
Chrome adds built-in mobile device emulation tools that will simplify your daily work.
Select any non-Console tab to find them, press the esc key on your keyboard and select the mobile device you want to touch.
You won't get a real iPhone of course, but the dimensions, touch events and agemt will all be emulated for you.

5. Improve your site through audits
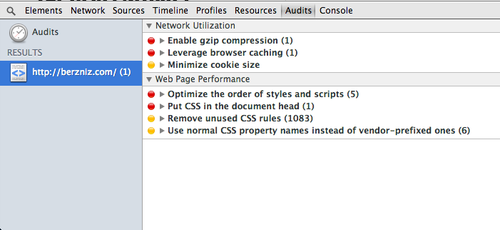
YSlow is a great tool. Chrome also includes a similar tool called Audits under Developer Tools.
Use a quick audit of your site to get useful, practical optimization tips.

What else?
I can’t imagine developing without these tools. I'll post more as I discover new ones, so stay tuned.


