When writing a JavaScript program, if you need to know the execution time of a certain piece of code, you can use console.time(). However, when analyzing JavaScript programs with more complex logic and trying to find performance bottlenecks, console.time() is not applicable - in-depth analysis of the operation of JavaScript programs with more complex logic means inserting a large number of console.time( ) statement, which is undoubtedly unacceptable. For JavaScript program tuning with complex logic, the correct method is to use console.profile().
Browser support
Firefox, Google Chrome and Safari with the Firebug plug-in installed all support the console.profile() statement. The latest versions of IE and Opera also provide the Profile function. The usage of console.profile() is similar in several major browsers. This article only introduces the usage of console.profile() in Firebug. One thing worth noting is that if you use the Firebug console to write JavaScript experiment code directly, console.profile() is invalid.
Usage of console.profile()
The use of console.profile() is very simple: insert console.profile() where you need to start the profile, and insert console.profileEnd() where you want to end the profile. Take the following code as an example:
console.profile();
doTask();
console.profileEnd();
Execute console.profile() before running the doTask() function, and execute console.profileEnd() after the doTask() function is completed. In this way, detailed information during the operation of the doTask() function can be collected. You can see this in Firebug’s console:

As you can see from the results: this profile time totaled 101.901ms, involving 5 function calls. The default title of the results is "Profile", which can be customized by passing parameters to the console.profile() function. For example, using console.profile("Test Profile") can change the title of the profile to "Test Profile" in the results, which is especially useful when multiple profile processes are executed at the same time. The meaning of each column in the specific profile results is:
1.Function. function name.
2. Calls. Number of calls. For example, in the above example, the doSubTaskA() function is executed twice.
3.Percent. The percentage of total time spent on this function call.
4.Own Time. Excluding the time spent calling other functions, the amount of time spent by the function itself. For example, in the above example, doTask() undoubtedly takes a long time to execute, but because all its time is spent on calling other functions, the time itself is not much, only 0.097ms.
5.Time. Contrary to Own Time, the total time taken by a function is calculated without considering calls to other functions. In the above example, the doTask() function executed for 101.901ms. Regarding Time and Own Time, we can also draw a conclusion: if Time is larger than Own Time, then the function involves calls to other functions.
6.Avg. Calculate the average total time taken by a function, and its calculation formula is: Avg=Time/Calls. In the above example, the doSubTaskA() function is executed twice, and its total time consumption is 1.054ms, so its average total time consumption is 0.527ms.
7.Min. The minimum time required to call this function. For example, in the above example, the doSubTaskA() function was executed twice, and its minimum time-consuming, that is, the less time-consuming call took 0.016ms.
8.Max. The maximum time required to call this function. For example, in the above example, the doSubTaskA() function was executed twice, and its maximum time-consuming, that is, the more time-consuming call took 1.038ms.
9.File. The JS file where the function is located.
Using the Profile button in Firebug
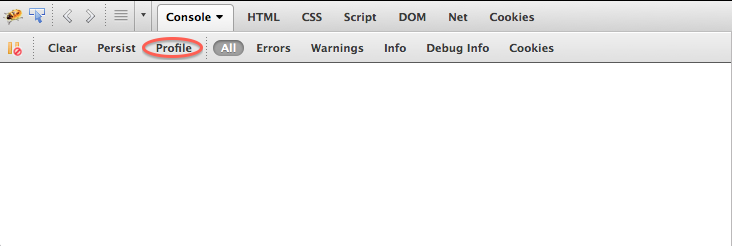
In addition to inserting the console.profile() statement in the JavaScript code, Firebug also provides a Profile button to dynamically profile the JavaScript code in the page in real time. The button location is:

When you need to profile, you can press this button. If the subsequent page operation triggers any JavaScript code, Firebug will record this. At the end of the profiling process just press the button again. The final result is consistent with the result obtained by inserting the console.profile() statement.


