 Web Front-end
 JS Tutorial
 Breakpoint settings and debugging tips for debugging JavaScript using Chrome_javascript tips
Breakpoint settings and debugging tips for debugging JavaScript using Chrome_javascript tips
May 16, 2016 pm 04:26 PMHow do you debug JavaScript programs? The most primitive method is to use alert() to print content on the page, and a slightly improved method is to use console.log() to output content on the JavaScript console. Well~, these two methods have indeed solved the debugging problems of many small JavaScript scripts. But it would be a shame to leave Chrome’s increasingly powerful developer tools unused. This article mainly introduces the JavaScript breakpoint setting and debugging functions, which is the Sources Panel (formerly called Scripts). If you are proficient in various Java debugging techniques in Eclipse, the concepts here are similar. The Chrome version used at the time of writing this article is 25.0.1364.172.
Basic environment

The left side of SourcesPanel is the content source, including various resources in the page. Among them, they are divided into Sources and Content scripts. Sources are the various resources contained in the page itself. They are organized according to the domains that appear on the page. This is what we want to focus on. Asynchronously loaded js files will also appear here after loading. Content scripts are an extension of Chrome. They are organized according to the extension ID. Such extensions are actually resources embedded in the page. They can also read and write the DOM. Developers who write and debug such extensions need to care about them. If your browser does not have any extensions installed, Content scripts will not see anything.
The middle main area of the Sources Panel is used to display the content of the resource files on the left.
The right side of the Sources Panel is the debugging ribbon. The top row of buttons are pause/continue, single-step execution, single-step in, single-step out, and disable/enable all breakpoints. Below are various specific functional areas. Introduced later.
Note that the left and right areas may be shrunk by default and not displayed on both sides. Click the retract buttons on both sides 
 to display them. The area on the left is automatically shrunk by default when displayed. Clicking the pin button
  next to it will not shrink it.
There are also some useful function buttons at the bottom.
Set a breakpoint on the source code
Open the corresponding JavaScript file through the content source on the left, and click the line number of the file to set and delete breakpoints. Each breakpoint added will appear in the Breakpoints list in the debugging area on the right. Clicking on the breakpoint in the list will locate the breakpoint in the content area. If you have multiple files and multiple breakpoints, it is very convenient to use the breakpoints in the Breakpoints list to quickly locate them.

For each added breakpoint there are two states: activated and disabled. The breakpoints just added are all in the activated state, and the disabled state means that the breakpoint is retained but the breakpoint function is temporarily cancelled. There is a checkbox in front of each breakpoint in the Breakpoints list. Unchecking it will disable the breakpoint. Breakpoints can also be disabled in the right-click menu of the breakpoint location. You can also temporarily disable all added breakpoints on the  button on the right ribbon, and click again to restore the original state.
Conditional breakpoint: Select "Edit Breakpoint..." in the right-click menu of the breakpoint location to set the conditions for triggering the breakpoint, which is to write an expression and trigger it only when the expression is true breakpoint. View the environment call stack (Call Stack) of the breakpoint: When the breakpoint stops, the Call Stack in the debugging area on the right will display the method call stack where the current breakpoint is located. For example, there is a function g() which calls a function f(), and I set a breakpoint in f(), then the breakpoint will be triggered when I execute the function g() in the console, and the call stack is displayed as follows:
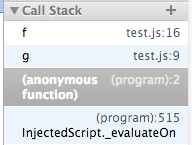
The top is f(), then g(). Each layer in the call stack is called a frame. Click on each frame to jump to the call point of the frame.
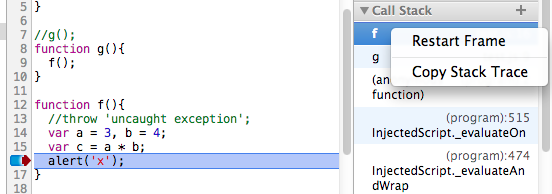
In addition, you can also use the right-click menu on the frame to restart execution of the current frame, that is, execute from the beginning of the frame. For example, if you restart Frame on the frame of function f(), the breakpoint will jump to the beginning of f() and re-executed, and the variable values in the context will also be restored. In this way, combined with functions such as variable modification and code editing, you can repeatedly debug in the current frame without refreshing the page and triggering breakpoints again. View variables
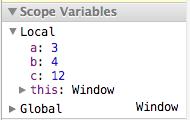
Below the Call Stack list is the Scope Variables list, where you can view the values of local variables and global variables at this time. Execute selected code

When debugging breakpoints, you can use the mouse to select the variable or expression you want to view, and then right-click the menu and execute "Evaluate in Console" to see the current value of the expression. Interrupt the JavaScript statement to be executed next time. The "Interrupt/Continue" button on the right side of the debugging area also has a function. When the breakpoint is not triggered, clicking this button will enter the "prepare" interrupt state. The next time the page Automatically interrupts when executing a JavaScript statement, such as code that is executed when a click action is triggered. Temporary modification of JavaScript code is usually used when debugging code: modify the code → refresh the page → recheck, such a cycle. But in fact, in Chrome, you can temporarily modify the contents of the JS file, save it (Ctrl S) and it will take effect immediately. Combined with functions such as Console, you can re-debug immediately. But please note that this modification is temporary and will be lost when you refresh the page.
Breakpoint on exception
You can see the  button at the bottom of the interface. It is a switch that sets whether to interrupt the program when it encounters an exception while running. Clicking this button will switch between 3 states:
 By default, it will not interrupt when encountering exceptions
 Will interrupt when encountering all exceptions, including caught cases
 Break only on uncaught exception
Mainly explain the difference between state 2 and state 3
try{
throw 'a exception';
}catch(e){
console.log(e);
}
The code in the try above will encounter an exception, but the following catch code can catch the exception. If all exceptions are interrupted, then the code will automatically interrupt when it reaches the throw statement that generates an exception; and if it only interrupts when uncaught exceptions are encountered, then there will be no interruption here. Generally we are more concerned about encountering uncaught exceptions.
Set a breakpoint on a DOM element
Sometimes we need to monitor the modification of a certain DOM, regardless of which line of code is modified (it may be modified in multiple places). Then we can set breakpoints directly on the DOM.

As shown in the figure, in the Elements Panel of Element Inspection, you can set breakpoints in three different situations in the right-click menu on an element: the child node modifies its own attributes, modifies its own node, is deleted and selected, the middle right of the Sources Panel The DOM breakpoint will appear in the DOM Breakpoints list on the side. Once executed to make corresponding modifications to the DOM, the code will stop there, as shown in the figure below. 
XHR Breakpoint
There is an XHR Breakpoints in the debugging area on the right. Click and enter the string contained in the URL to monitor the Ajax request of the URL. The input content is equivalent to the URL filter. If nothing is filled in, all XHR requests will be listened to. Once the XHR call is triggered it will break at request.send().
Trigger breakpoints by event type
Event Listener list in the debugging area on the right, various possible event types are listed here. Check the corresponding event type and it will automatically interrupt when the JavaScript code of this type of event is triggered.
Debugging shortcut keys
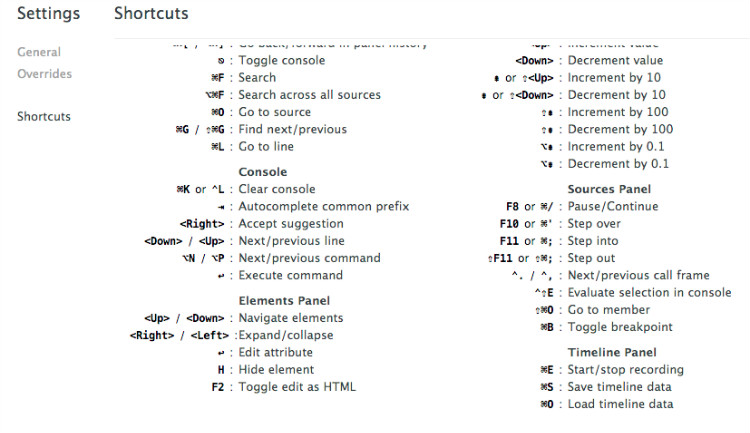 The shortcut keys in all development tools can be found in the settings in the lower right corner of the interface. F8, F10, F11 or Shitf F11 are generally used for breakpoint debugging, but on Mac OS, function keys such as F10 may conflict with the system's default shortcut keys. It doesn't matter, they can be replaced by Cmd / , Cmd ' , Cmd ; , Shift Cmd ; respectively. //@ sourceURL Name the code generated by eval. Sometimes some very dynamic code is created in the current Javascript context in the form of a string through the eval() function, rather than being loaded as an independent js file. This way you won't be able to find the file in the content area on the left, making it difficult to debug. In fact, we only need to add a line "//@ sourceURL=name" to the end of the code created by eval to name this code (the browser will treat this special form of comment specially), so that it will Appears in the content area on the left, just like you loaded a js file with a specified name, and you can set breakpoints and debug. In the picture below, we execute a piece of code through eval and name it dynamicScript.js using sourceURL. After execution, this "file" appears in the left content area, and its content is the content in eval.
  You can also take a look at this example of naming dynamically compiled CoffeeScript code:
var coffee = CoffeeScript.compile(code.value) "//@ sourceURL=" (evalName.value || "Coffeeeeeeee!");
eval(coffee);
In fact, //@ sourceURL can be used not only in eval code, but also in any js file or even code entered in the Javascript Console, with the same effect! Format code (Pretty Print)  button is used to reformat messy code into beautiful code. For example, some compressed js files are basically impossible to read, let alone debug. Click once to format, and click again to cancel formatting.
 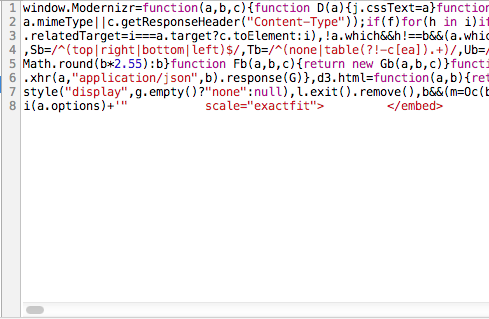 Before beautification
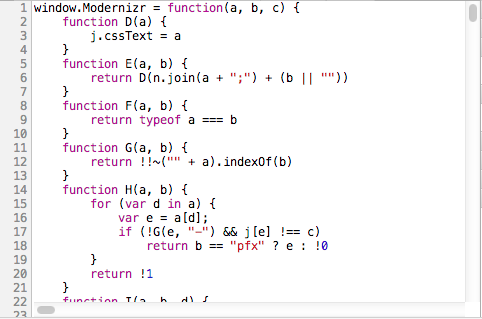 Reference materials after beautification: Chrome Developer Tools official documentation

Hot Article

Hot tools Tags

Hot Article

Hot Article Tags

Notepad++7.3.1
Easy-to-use and free code editor

SublimeText3 Chinese version
Chinese version, very easy to use

Zend Studio 13.0.1
Powerful PHP integrated development environment

Dreamweaver CS6
Visual web development tools

SublimeText3 Mac version
God-level code editing software (SublimeText3)

Hot Topics
 What is Updater.exe in Windows 11/10? Is this the Chrome process?
Mar 21, 2024 pm 05:36 PM
What is Updater.exe in Windows 11/10? Is this the Chrome process?
 How to solve the problem that Google Chrome cannot open web pages
Jan 04, 2024 pm 10:18 PM
How to solve the problem that Google Chrome cannot open web pages
 What is the Chrome plug-in extension installation directory?
Mar 08, 2024 am 08:55 AM
What is the Chrome plug-in extension installation directory?
 How to implement an online speech recognition system using WebSocket and JavaScript
Dec 17, 2023 pm 02:54 PM
How to implement an online speech recognition system using WebSocket and JavaScript
 How to search for text across all tabs in Chrome and Edge
Feb 19, 2024 am 11:30 AM
How to search for text across all tabs in Chrome and Edge
 WebSocket and JavaScript: key technologies for implementing real-time monitoring systems
Dec 17, 2023 pm 05:30 PM
WebSocket and JavaScript: key technologies for implementing real-time monitoring systems
 How to implement an online reservation system using WebSocket and JavaScript
Dec 17, 2023 am 09:39 AM
How to implement an online reservation system using WebSocket and JavaScript
 How to block access to a website in chrome
Apr 16, 2024 pm 07:52 PM
How to block access to a website in chrome


