

Google Maps propose de nombreuses fonctionnalités permettant de tracer des points sur une carte, mais que se passe-t-il si vous souhaitez tracer des points sur une image ? Ces cartes de tracé d'images XY sont couramment utilisées pour les plans d'étage, les inspections de chantier et même les jeux.
Dans ce guide, je vais vous montrer comment créer une carte interactive avec des points déplaçables à l'aide de Leaflet.js et de Google Apps Script. Nous couvrirons tout, de la configuration de la carte à l'intégration des données de Google Sheets et à son déploiement en tant qu'application Web.
Ce guide couvrira :
Configuration de Leaflet.js dans un service HTML Google Apps Script
Affichage des marqueurs à l'aide des données de Google Sheets
Mise à jour de la ligne des feuilles lorsqu'un marqueur est déplacé
Création de nouveaux marqueurs à partir de la carte et enregistrement dans Sheets
Supprimer un marqueur de l'application web
Leaflet.js est l'une des bibliothèques de cartographie open source les plus populaires. Il est léger, facile à utiliser et dispose d'une excellente documentation. Ils prennent en charge une tonne de types de cartes différents, y compris "CRS.Simple" ou Coordonnées de référence, qui vous permet de fournir une image d'arrière-plan.
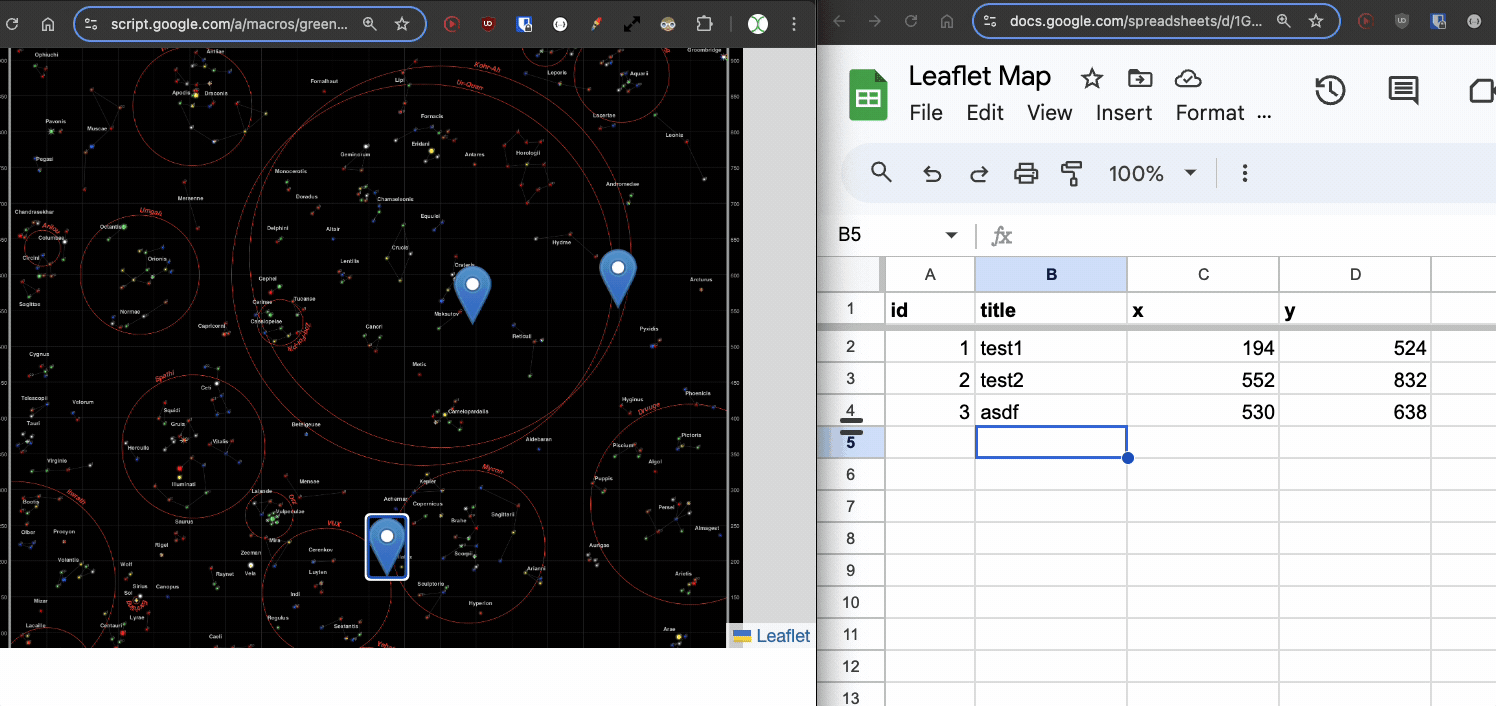
Commencez par créer une feuille nommée map_pin avec la structure suivante :
| id | title | x | y |
|---|---|---|---|
| 1 | test1 | 10 | 30 |
| 2 | test2 | 50 | 80 |
Then open Apps Script from the Extensions menu.
First, we'll start with the basic example from the Leaflet docs, just to get the library working. You can see the full example in their quick start guide, here.
Add a new HTML File named Index, and set the content to:
<!DOCTYPE html>
<html>
<head>
<title>Quick Start - Leaflet</title>
<meta charset="utf-8" />
<meta name="viewport" content="width=device-width, initial-scale=1.0">
<link rel="stylesheet" href="https://unpkg.com/leaflet@1.9.3/dist/leaflet.css" />
<style>
#map {
height: 400px;
}
</style>
</head>
<body>
<div id="map"></div>
<script src="https://unpkg.com/leaflet@1.9.3/dist/leaflet.js"></script>
<script>
var map = L.map('map').setView([40.73, -73.99], 13);
L.tileLayer('https://{s}.tile.openstreetmap.org/{z}/{x}/{y}.png', {
maxZoom: 19,
attribution: '© OpenStreetMap'
}).addTo(map);
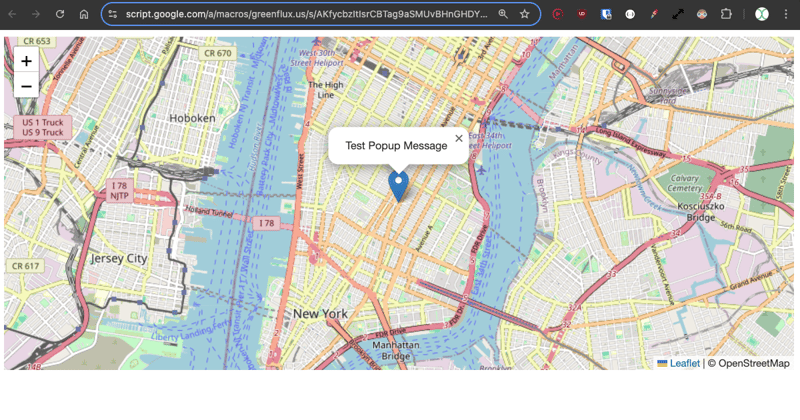
var marker = L.marker([40.73, -73.99]).addTo(map)
.bindPopup('Test Popup Message')
.openPopup();
</script>
</body>
</html>
Then update the Code.gs file with:
function doGet() {
  const html = HtmlService.createHtmlOutputFromFile('Index')
    .setTitle('Map with Draggable Points')
    .setXFrameOptionsMode(HtmlService.XFrameOptionsMode.ALLOWALL);
  return html;
}
Save, and then click Deploy, and publish as a web app. Then open the link for the new deployment and you should see Leaflet.js displaying a map on New York.
Ok, that's the regular map example using Leaflet. Now on to the CRS.Simple map type, which allows supplying a background image.
Update the HTML with this example from the Leaflet Tutorials.
<!DOCTYPE html>
<html>
<head>
<title>CRS Simple Example - Leaflet</title>
<meta charset="utf-8" />
<meta name="viewport" content="width=device-width, initial-scale=1.0">
<link rel="stylesheet" href="https://unpkg.com/leaflet@1.9.3/dist/leaflet.css" />
<style>
#map {
height: 400px;
width: 600px;
}
body {
margin: 0;
padding: 0;
}
</style>
</head>
<body>
<div id="map"></div>
<script src="https://unpkg.com/leaflet@1.9.3/dist/leaflet.js"></script>
<script>
// Set up the map with a simple CRS (no geographic projection)
var map = L.map('map', {
crs: L.CRS.Simple,
minZoom: -1,
maxZoom: 4
});
// Define the dimensions of the image
var bounds = [[0, 0], [1000, 1000]];
var image = L.imageOverlay('https://leafletjs.com/examples/crs-simple/uqm_map_full.png', bounds).addTo(map);
// Set the initial view of the map to show the whole image
map.fitBounds(bounds);
// Optional: Add a marker or other elements to the map
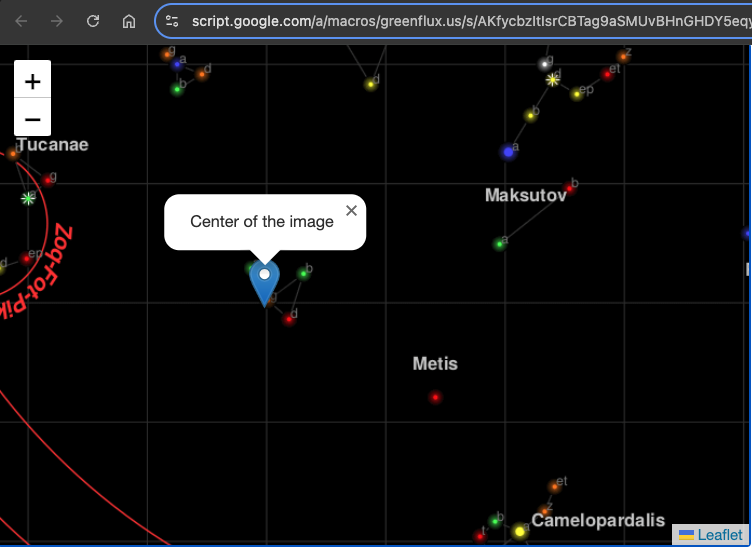
var marker = L.marker([500, 500]).addTo(map)
.bindPopup('Center of the image')
.openPopup();
</script>
</body>
</html>
Here we are supplying an image of 1000 x 1000 pixels, then setting the center marker at 500, 500.
Click Save, then Deploy>Test Deployments, to see the new map type. You should now have a map with a background image and a marker plotted in the center.
Next, we'll use data from the sheet to populate a set of markers on the map.
First, add a function to the Code.gs file to get the marker locations:
function getPinData(){
  const ss = SpreadsheetApp.getActiveSpreadsheet();
  const sh = ss.getSheetByName('map_pin');
  const data = sh.getDataRange().getValues();
  const json = arrayToJSON(data);
  //Logger.log(json);
  return json
}

function arrayToJSON(data=getPinData()){
  const headers = data[0];
  const rows = data.slice(1);
  let jsonData = [];
  for(row of rows){
    const obj = {};
    headers.forEach((h,i)=>obj[h] = row[i]);
    jsonData.push(obj)
  }
  //Logger.log(jsonData)
  return jsonData
}
Here I'm returning the pins as JSON so they're easier to work with in the HTML in the next section.
Now add a function to the HTML to loop over this JSON and create the map pins after the map has loaded.
// Add map pins from sheet data
    google.script.run.withSuccessHandler(addMarkers).getPinData();

    function addMarkers(mapPinData) {
      mapPinData.forEach(pin => {
        const marker = L.marker([pin.x, pin.y], {
          draggable: true
        }).addTo(map);

        marker.bindPopup(`<b>${pin.title}`).openPopup();

        marker.on('dragend', function(e) {
          const latLng = e.target.getLatLng();
          console.log(`Marker ${pin.title} moved to: ${latLng.lat}, ${latLng.lng}`);
        });
      });
    }
Save, and then open the test deployment. You should now have markers generated from your sheet data!
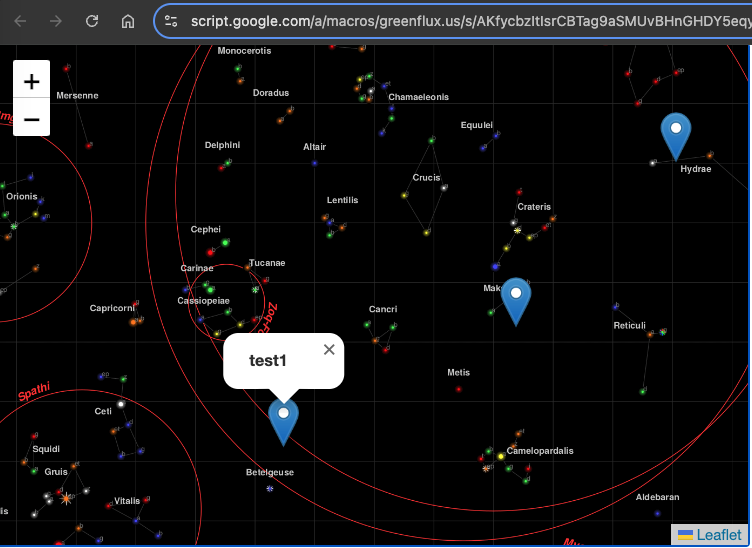
Each pin has a popup with the title from that row. The pins are draggable at this point, but we still need a function to save the new position.
To save the new position, we need two functions: one in the HTML to capture the event on the client side, and one to save the new position on the server side, in the Code.gs file.
Update the HTML with:
    function addMarkers(mapPinData) {
      mapPinData.forEach(pin => {
        const { id, title, x, y } = pin;
        const marker = L.marker([x, y], {
          draggable: true
        }).addTo(map);

        marker.bindPopup(`<b>${title}</b>`).openPopup();

        marker.on('dragend', function(e) {
          const latLng = e.target.getLatLng();
          console.log(`Marker ${title} moved to: ${latLng.lat}, ${latLng.lng}`);
          saveMarkerPosition({ id, title, lat: latLng.lat, lng: latLng.lng });
        });
      });
    }

    function saveMarkerPosition({ id, title, lat, lng }) {
      google.script.run.saveMarkerPosition({ id, title, lat, lng });
    }
And then add a function to the Code.gs file to save the location:
function saveMarkerPosition({ id, lat, lng }) {
  const ss = SpreadsheetApp.getActiveSpreadsheet();
  const sh = ss.getSheetByName('map_pin');
  const data = sh.getDataRange().getValues();

  for (let i = 1; i < data.length; i++) {
    if (data[i][0] === id) {  // ID column (index 0)
      sh.getRange(i + 1, 3).setValue(lat);  // latitude column
      sh.getRange(i + 1, 4).setValue(lng);  // longitude column
      break;
    }
  }
}
Save, and refresh the test deployment. You should now see the sheet update when a marker is dragged!
We can now move the existing points, but what about adding new ones? Again, we'll need two functions, one in the HTML, and one in the Code.gs file.
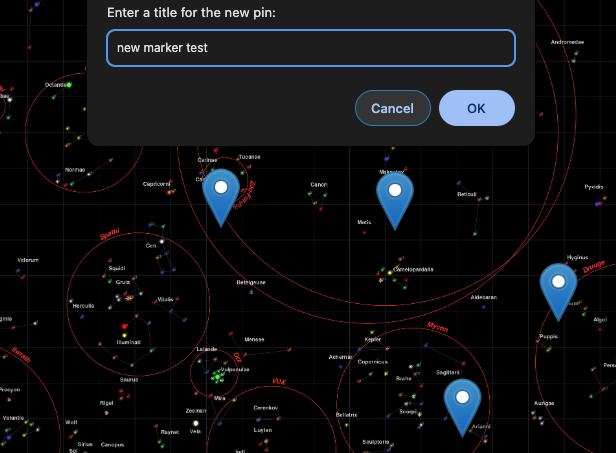
First, add a function to the HTML to open a prompt when the user clicks an empty spot on the map, and pass the value to a server function.
    // Function to add a new pin
    map.on('click', function(e) {
      const latLng = e.latlng;
      const title = prompt('Enter a title for the new pin:');
      if (title) {
        google.script.run.withSuccessHandler(function(id) {
          addNewMarker({ id, title, lat: latLng.lat, lng: latLng.lng });
        }).addNewPin({ title, lat: latLng.lat, lng: latLng.lng });
      }
    });

    function addNewMarker({ id, title, lat, lng }) {
      const marker = L.marker([lat, lng], {
        draggable: true
      }).addTo(map);

      marker.bindPopup(`<b>${title}</b>`).openPopup();

      marker.on('dragend', function(e) {
        const latLng = e.target.getLatLng();
        saveMarkerPosition({ id, title, lat: latLng.lat, lng: latLng.lng });
      });
    }
Then add the function to the Code.gs to save the new row.
function addNewPin({ title, lat, lng }) {
  const ss = SpreadsheetApp.getActiveSpreadsheet();
  const sh = ss.getSheetByName('map_pin');

  // Check if there are any rows present, if not initialize ID
  const lastRow = sh.getLastRow();
  let newId = 1;

  if (lastRow > 0) {
    const lastId = sh.getRange(lastRow, 1).getValue();
    newId = lastId + 1;
  }

  sh.appendRow([newId, title, lat, lng]);

  return newId;
}
Save once more and refresh the test deployment. Now when you click an empty spot, you can enter a title and save a new marker!
Lastly, we should add a way to delete markers, giving us a full CRUD app in map view.
Update the add marker function to give the popup a delete button:
      const popupContent = `<b>${title}</b><br><button onclick="deleteMarker(${id})">Delete Marker</button>`;
      marker.bindPopup(popupContent).openPopup();
And then add a function for deleting from the client side:
// Function to delete a marker
  function deleteMarker(id) {
    const confirmed = confirm('Are you sure you want to delete this marker?');
    if (confirmed) {
      google.script.run.withSuccessHandler(() => {
        // Refresh the markers after deletion
        google.script.run.withSuccessHandler(addMarkers).getPinData();
      }).deleteMarker(id);
    }
  }
Then add the matching function to the Code.gs file:
function deleteMarker(id) {
  const ss = SpreadsheetApp.getActiveSpreadsheet();
  const sh = ss.getSheetByName('map_pin');
  const data = sh.getDataRange().getValues();

  for (let i = 1; i < data.length; i++) {
    if (data[i][0] === id) {  // ID column (index 0)
      sh.deleteRow(i + 1);  // Delete the row
      break;
    }
  }
}
There's a ton more you could do from here, like adding other data points to each marker, dynamic background images, or other click and drag interactions. You could even make a game! Got an idea for a use case? Drop a comment below!
Ce qui précède est le contenu détaillé de. pour plus d'informations, suivez d'autres articles connexes sur le site Web de PHP en chinois!


![[Web front-end] Démarrage rapide de Node.js](https://img.php.cn/upload/course/000/000/067/662b5d34ba7c0227.png)


