

Fonction Excel Groupby pour regrouper les lignes et les valeurs agrégées

Unlock the Power of Excel's GROUPBY Function for Enhanced Data Analysis! This function simplifies data grouping, summarization, sorting, and filtering, all within a single formula. Say goodbye to complex outlines, subtotals, and pivot tables – GROUPBY streamlines your workflow.
Excel's data analysis capabilities just got a significant boost. While features like outlines and pivot tables have long been staples for organizing and interpreting data, the new GROUPBY function offers a more streamlined approach, all within the convenience of your formula bar.
- Understanding the Excel GROUPBY Function: Syntax and Basic Applications
- GROUPBY Function Availability and Compatibility
- Constructing a Basic GROUPBY Formula
- Mastering GROUPBY: Advanced Formula Examples
- Selecting the Right Aggregation Function
- Displaying Headers Effectively
- Grouping Rows Using Multiple Columns
- Grouping with Non-Adjacent Columns
- Controlling the Display of Totals and Subtotals
- Sorting Grouped Data
- Filtering Results
- Aggregating Multiple Columns (Adjacent and Non-Adjacent)
- Multiple Aggregations on a Single Dataset
- Handling Comma-Separated Text Strings
- Auto-Formatting GROUPBY Results with Conditional Formatting
- Troubleshooting GROUPBY Function Issues
The Excel GROUPBY Function
The GROUPBY function efficiently groups and aggregates data rows based on values in one or more columns. It also supports sorting and filtering of grouped data. As a dynamic array function, it returns multiple results, spilling into adjacent cells. The output resembles a pivot table without the formatting; the spill range dynamically recalculates with data changes. This is particularly beneficial for large datasets requiring summarized data through functions like SUM, AVERAGE, or COUNT.

Note: GROUPBY is similar to PIVOTBY, but GROUPBY exclusively groups data in rows.
Function Syntax
GROUPBY(row_fields, values, function, [field_headers], [total_depth], [sort_order], [filter_array])
Seven arguments are available, but only the first three are mandatory:
-
row_fields(required): The range of values to group by. -
values(required): The values to aggregate. -
function(required): The aggregation function (e.g.,SUM,AVERAGE,COUNT,MIN,MAX). -
field_headers(optional): Controls header display (0: No headers, 1: Yes, but don't show, 2: No headers, but generate, 3: Yes, and show). -
total_depth(optional): Controls total/subtotal display (0: No totals, 1: Grand total at bottom, 2: Grand and subtotals at bottom, -1: Grand total at top, -2: Grand and subtotals at top). -
sort_order(optional): Sorts by column index (positive for ascending, negative for descending). Arrays allow multi-column sorting. -
filter_array(optional): Filters rows using a Boolean array.
Usage Tips
- Dynamic Updates: The formula dynamically adjusts to dataset changes within its range. Adding new rows requires including them in the argument ranges or using an Excel table for automatic expansion.
-
Header Detection: If
field_headersis omitted, Excel infers headers based on thevaluesargument (text followed by a number suggests headers). -
Range Consistency:
row_fieldsandvaluesmust have equal lengths to avoid#VALUE!errors. - Conditional Formatting: Enhance readability by using conditional formatting to highlight totals and subtotals.
Note: GROUPBY is under development; thorough testing is recommended.
GROUPBY Function Availability
Currently available in Excel for Microsoft 365 (Insider Beta Channel).
Basic GROUPBY Formula
Let's assume a dataset with project names (Column A), types (Column B), and revenues (Column C). To summarize revenues by project type:
=GROUPBY(B2:B32, C2:C32, SUM)
This yields a list of unique project types with their revenue sums. Defaults are used for optional arguments (no headers, ascending sort, grand total at bottom).

Advanced GROUPBY Formula Examples
This section expands on the basic example, demonstrating the function's versatility.
Choosing the Aggregation Function
GROUPBY supports 16 aggregation functions, including standard functions (SUM, AVERAGE, COUNT, etc.) and specialized ones (PERCENTOF, ARRAYTOTEXT). These are eta-reduced lambdas, simplifying usage. Custom lambda functions are also supported. Multiple aggregations are possible using vectors (vertical for column stacking, horizontal for row stacking).
Displaying Headers
Use the field_headers argument (set to 3) to include headers in the output.
=GROUPBY(B2:B32, C2:C32, SUM, 3)

Grouping by Multiple Columns
Include a multi-column range in row_fields to group by multiple columns. For example, grouping by project type and status:
=GROUPBY(B2:C32, D2:D32, COUNT)

Grouping by Non-Adjacent Columns
Use CHOOSECOLS to select non-adjacent columns for grouping:
=GROUPBY(CHOOSECOLS(A2:D32, 2, 4), C2:C32, COUNT)

Controlling Totals and Subtotals
Use total_depth to control total/subtotal display. Setting it to 2 shows both grand and subtotals.
=GROUPBY(B2:C32, D2:D32, SUM, 3, 2)

Sorting Grouped Rows
Use sort_order for custom sorting (positive for ascending, negative for descending). Arrays enable multi-column sorting.
=GROUPBY(B2:B32, C2:C32, SUM, , , 2) (Sorts by values)

=GROUPBY(B2:C32, D2:D32, SUM, , , {-1,2}) (Multi-column sort)

Filtering Results
Use filter_array (Boolean array) to filter rows.
=GROUPBY(B2:B32, C2:C32, SUM, , , , B2:B32<>"Design")

Aggregating Multiple Columns
Aggregate adjacent columns directly:
=GROUPBY(B2:B32, D2:E32, AVERAGE, 3)

For non-adjacent columns, use CHOOSECOLS:
=GROUPBY(B2:B32, CHOOSECOLS(C2:E32, 1, 3), AVERAGE, 3)

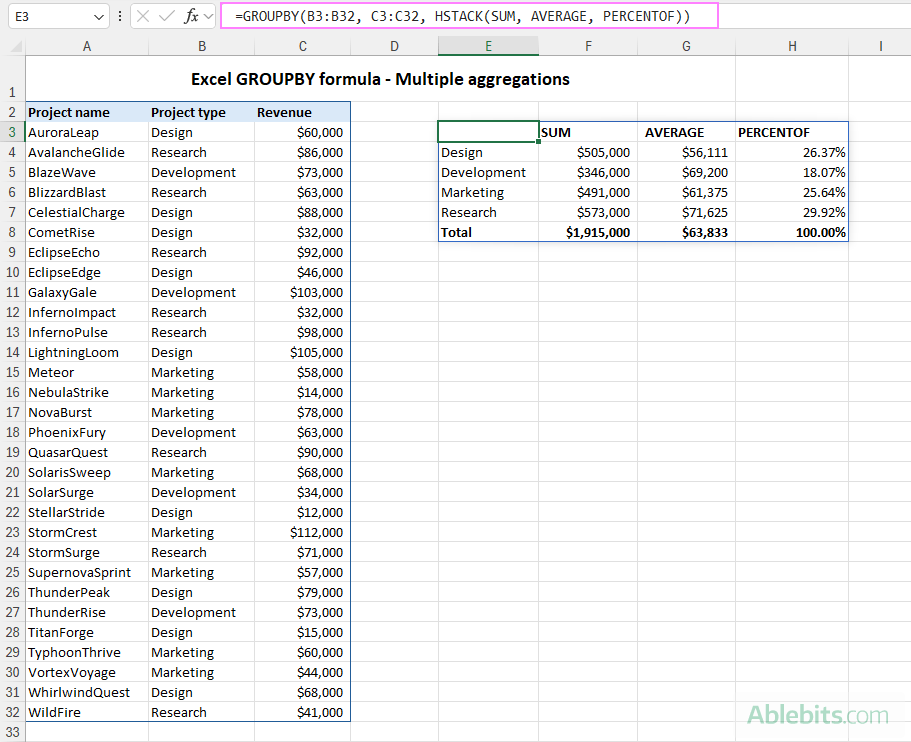
Multiple Aggregations on the Same Data
Use HSTACK or VSTACK for multiple aggregations:
=GROUPBY(B3:B32, C3:C32, HSTACK(SUM, AVERAGE, PERCENTOF))
=GROUPBY(B3:B32, C3:C32, VSTACK(SUM, AVERAGE, MIN, MAX),, 0)

Grouping Comma-Separated Text Values
Use ARRAYTOTEXT to group comma-separated text:
=GROUPBY(B3:B23, A3:A23, ARRAYTOTEXT, 0, 0)

Conditional Formatting of GROUPBY Results
Enhance visual clarity using conditional formatting to highlight headers, totals, and subtotals.
Troubleshooting GROUPBY Function Issues
- Function Unavailability: Ensure you have a Microsoft 365 subscription and the latest updates.
-
#VALUE!Error: Check for equal lengths inrow_fieldsandvaluesarguments, and ensure correctfilter_arraylength. Also, verify thattotal_depthis appropriate for the number of columns inrow_fields. -
#SPILL!Error: Clear adjacent cells to allow spill range.
In conclusion, the GROUPBY function significantly enhances Excel's data analysis capabilities, providing a powerful and efficient tool for various data manipulation tasks. With practice, you'll unlock its full potential for insightful data analysis.
Ce qui précède est le contenu détaillé de. pour plus d'informations, suivez d'autres articles connexes sur le site Web de PHP en chinois!

Outils d'IA chauds

Undresser.AI Undress
Application basée sur l'IA pour créer des photos de nu réalistes

AI Clothes Remover
Outil d'IA en ligne pour supprimer les vêtements des photos.

Undress AI Tool
Images de déshabillage gratuites

Clothoff.io
Dissolvant de vêtements AI

Video Face Swap
Échangez les visages dans n'importe quelle vidéo sans effort grâce à notre outil d'échange de visage AI entièrement gratuit !

Article chaud
Outils chauds

Bloc-notes++7.3.1
Éditeur de code facile à utiliser et gratuit

SublimeText3 version chinoise
Version chinoise, très simple à utiliser

Envoyer Studio 13.0.1
Puissant environnement de développement intégré PHP

Dreamweaver CS6
Outils de développement Web visuel

SublimeText3 version Mac
Logiciel d'édition de code au niveau de Dieu (SublimeText3)
Sujets chauds
 1659
1659
 14
1415
52
1310
25
1258
29
1232
24
14
1415
52
1310
25
1258
29
1232
24

 Formule médiane dans Excel - Exemples pratiques
Apr 11, 2025 pm 12:08 PM
Formule médiane dans Excel - Exemples pratiques
Apr 11, 2025 pm 12:08 PM
Ce tutoriel explique comment calculer la médiane des données numériques dans Excel en utilisant la fonction médiane. La médiane, une mesure clé de la tendance centrale, identifie la valeur moyenne dans un ensemble de données, offrant une représentation plus robuste de Central Tenden
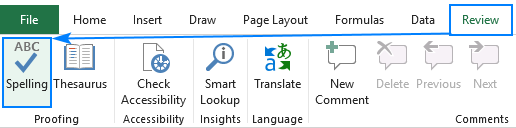 Comment vérifier l'orthographe dans Excel
Apr 06, 2025 am 09:10 AM
Comment vérifier l'orthographe dans Excel
Apr 06, 2025 am 09:10 AM
Ce didacticiel montre diverses méthodes de vérification des sorts dans Excel: vérifications manuelles, macros VBA et utilisant un outil spécialisé. Apprenez à vérifier l'orthographe dans les cellules, les gammes, les feuilles de travail et les classeurs entiers. Bien qu'Excel ne soit pas un traitement de texte, son Spel
 Excellent classeur partagé: comment partager un fichier Excel pour plusieurs utilisateurs
Apr 11, 2025 am 11:58 AM
Excellent classeur partagé: comment partager un fichier Excel pour plusieurs utilisateurs
Apr 11, 2025 am 11:58 AM
Ce tutoriel fournit un guide complet pour partager des classeurs Excel, couvrant diverses méthodes, contrôle d'accès et résolution des conflits. Les versions Excel modernes (2010, 2013, 2016 et plus tard) simplifient l'édition collaborative, éliminant la nécessité de m
 Fonction de contes de feuille de calcul Google avec des exemples de formule
Apr 11, 2025 pm 12:03 PM
Fonction de contes de feuille de calcul Google avec des exemples de formule
Apr 11, 2025 pm 12:03 PM
Master Google Sheets Counif: un guide complet Ce guide explore la fonction Countif polyvalente dans Google Sheets, démontrant ses applications au-delà du simple comptage de cellules. Nous couvrirons divers scénarios, des matchs exacts et partiels à Han
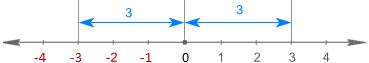 Valeur absolue dans Excel: Fonction ABS avec des exemples de formule
Apr 06, 2025 am 09:12 AM
Valeur absolue dans Excel: Fonction ABS avec des exemples de formule
Apr 06, 2025 am 09:12 AM
Ce didacticiel explique le concept de valeur absolue et démontre des applications Excel pratiques de la fonction ABS pour calculer les valeurs absolues dans les ensembles de données. Les nombres peuvent être positifs ou négatifs, mais parfois seules des valeurs positives ont besoin
 Excel: les lignes de groupement automatiquement ou manuellement, effondrent et développent les lignes
Apr 08, 2025 am 11:17 AM
Excel: les lignes de groupement automatiquement ou manuellement, effondrent et développent les lignes
Apr 08, 2025 am 11:17 AM
Ce tutoriel montre comment rationaliser les feuilles de calcul Excel complexes en regroupant les lignes, ce qui rend les données plus faciles à analyser. Apprenez à cacher ou à afficher rapidement les groupes de lignes et à effondrer l'ensemble du contour à un niveau spécifique. De grandes feuilles de calcul détaillées peuvent être
 Comment convertir Excel en JPG - Enregistrer .xls ou .xlsx comme fichier image
Apr 11, 2025 am 11:31 AM
Comment convertir Excel en JPG - Enregistrer .xls ou .xlsx comme fichier image
Apr 11, 2025 am 11:31 AM
Ce didacticiel explore diverses méthodes de conversion de fichiers .xls en images .jpg, englobant à la fois des outils Windows intégrés et des convertisseurs en ligne gratuits. Besoin de créer une présentation, de partager les données de la feuille de calcul en toute sécurité ou de concevoir un document? Convertir Yo
 Tutoriel du graphique Google Sheets: comment créer des graphiques dans Google Sheets
Apr 11, 2025 am 09:06 AM
Tutoriel du graphique Google Sheets: comment créer des graphiques dans Google Sheets
Apr 11, 2025 am 09:06 AM
Ce tutoriel vous montre comment créer divers graphiques dans Google Sheets, en choisissant le bon type de graphique pour différents scénarios de données. Vous apprendrez également à créer des graphiques 3D et Gantt, et comment modifier, copier et supprimer des graphiques. La visualisation des données est CRU
