

[root@mxqmongodb2 tpccmysql]# gunzip tpcc-mysql-src.tgz[root@mxqmongodb2 tpccmysql]# tar xf tpcc-mysql-src.tar[root@mxqmongodb2 tpcc-mysql-master]# cd src/[root@mxqmongodb2 src]# make[root@mxqmongodb2 src]# cd ..[root@mxqmongodb2 tpcc-mysql-master]# ls
add_fkey_idx.sql count.sql create_table.sql Dockerfile drop_cons.sql load_multi_schema.sh load.sh README.md schema2 scripts src tpcc_load tpcc_start
mysql> create database tpcc1000;
Query OK, 1 row affected (0.04 sec)
mysql> use tpcc1000;Database changed
mysql> source /home/tpccmysql/tpcc-mysql-master/create_table.sql;
mysql> source /home/tpccmysql/tpcc-mysql-master/add_fkey_idx.sql;
[root@mxqmongodb2 tpcc-mysql-master]# ./tpcc_start --help****************************************** ###easy### TPC-C Load Generator ******************************************./tpcc_start: invalid option -- '-'Usage: tpcc_start -h server_host -P port -d database_name -u mysql_user -p mysql_password -w warehouses -c connections -r warmup_time -l running_time -i report_interval -f report_file -t trx_file
./tpcc_start -h10.103.16.35 -P3306 -dtpcc1000 -uroot -p123456 -w30 -c50 -r300 -l600
[root@mxqmongodb2 tpcc-mysql]# ./tpcc_start -h127.0.0.1 -P3306 -d tpcc -u root -p123456 -w 10 -c 50 -r 30 -l 300****************************************** ###easy### TPC-C Load Generator ******************************************option h with value '127.0.0.1'option P with value '3306'option d with value 'tpcc'option u with value 'root'option p with value '123456'option w with value '10'option c with value '50'option r with value '30'option l with value '300'<Parameters>[server]: 127.0.0.1[port]: 3306[DBname]: tpcc[user]: root[pass]: 123456[warehouse]: 10[connection]: 50[rampup]: 30 (sec.)[measure]: 300 (sec.)

RAMP-UP TIME.(30 sec.)

MEASURING START.
10, 140(0):3.055|3.476, 141(0):0.693|0.975, 14(0):0.326|0.334, 11(0):3.550|3.593, 15(0):9.091|9.11920, 240(0):3.092|3.143, 242(0):0.668|0.730, 24(0):0.320|0.356, 26(0):3.533|3.596, 23(0):8.280|8.48030, 232(0):2.981|3.110, 233(0):0.680|1.052, 23(0):0.329|0.360, 24(0):3.591|3.596, 23(0):9.042|9.40740, 137(0):3.148|3.968, 136(0):0.658|0.713, 14(0):0.329|0.353, 13(0):3.677|3.682, 15(0):8.660|9.28950, 149(0):2.984|3.334, 145(0):0.662|0.665, 14(0):0.310|0.334, 14(0):3.572|3.687, 13(0):9.155|9.49760, 137(0):2.863|3.152, 142(0):0.674|0.689, 15(0):0.247|0.262, 14(0):3.308|3.548, 15(0):8.362|9.23670, 157(0):3.144|3.410, 152(0):0.619|0.681, 15(0):0.339|0.414, 16(0):3.546|3.610, 16(0):8.440|9.62780, 184(0):3.073|3.221, 182(0):0.678|0.707, 18(0):0.352|0.352, 18(0):3.693|3.766, 19(0):8.643|9.02090, 192(0):3.035|3.668, 196(0):0.658|0.793, 20(0):0.298|0.400, 19(0):3.572|4.125, 18(0):8.267|9.535100, 156(0):3.041|3.301, 153(0):0.647|0.679, 15(0):0.276|0.279, 16(0):3.436|3.497, 17(0):8.379|8.510110, 167(0):2.900|3.178, 168(0):0.663|0.674, 17(0):0.294|0.297, 16(0):3.517|3.625, 16(0):8.262|8.626120, 188(0):3.094|3.217, 190(0):0.638|0.740, 19(0):0.276|0.288, 20(0):3.472|3.697, 19(0):8.589|8.891130, 161(0):3.295|3.617, 163(0):0.668|0.717, 16(0):0.346|0.393, 15(0):3.421|3.730, 16(0):9.250|10.387140, 171(0):2.938|3.343, 168(0):0.683|0.714, 17(0):0.312|0.321, 18(0):3.471|3.513, 18(0):8.190|8.602150, 179(0):3.029|3.250, 178(0):0.694|0.813, 18(0):0.329|0.331, 16(0):3.571|3.623, 16(0):8.097|8.610160, 123(0):2.938|3.333, 119(0):0.606|0.621, 12(0):0.278|0.293, 13(0):3.497|3.506, 13(0):8.327|8.454170, 175(0):3.130|3.595, 179(0):0.666|0.778, 17(0):0.274|0.277, 18(0):3.638|4.027, 18(0):8.762|9.156180, 187(0):3.146|3.427, 187(0):0.704|0.743, 20(0):0.312|0.322, 19(0):3.562|3.593, 18(0):8.282|9.524190, 146(0):2.926|3.112, 143(0):0.641|0.701, 14(0):0.301|0.339, 14(0):3.475|3.592, 15(0):7.896|8.596200, 189(0):3.028|3.277, 200(0):0.661|0.730, 19(0):0.300|0.319, 20(0):3.550|3.595, 20(0):8.361|8.659210, 191(0):2.910|3.196, 184(0):0.618|0.720, 19(0):0.324|0.329, 17(0):3.448|3.463, 18(0):8.372|8.558220, 143(0):3.057|3.116, 162(0):0.655|0.691, 15(0):0.259|0.355, 15(0):3.519|3.547, 14(0):8.816|8.893230, 189(0):2.930|3.057, 169(0):0.630|0.682, 18(0):0.331|0.349, 19(0):3.575|3.864, 19(0):8.359|8.391240, 131(0):2.958|3.035, 130(0):0.643|0.681, 14(0):0.273|0.326, 12(0):3.490|3.520, 13(0):8.671|9.160250, 125(0):2.939|3.237, 124(0):0.659|0.707, 12(0):0.301|0.367, 12(0):3.464|3.527, 13(0):8.643|8.774260, 127(0):2.895|2.983, 131(0):0.669|0.704, 13(0):0.328|0.360, 16(0):3.468|3.665, 12(0):8.433|8.562270, 177(0):2.962|3.375, 174(0):0.686|0.722, 17(0):0.302|0.364, 16(0):3.548|3.629, 18(0):8.309|8.354280, 139(0):2.874|3.047, 142(0):0.675|0.935, 15(0):0.280|0.294, 16(0):3.483|3.628, 14(0):8.154|8.730290, 163(0):3.132|3.213, 162(0):0.636|0.663, 15(0):0.282|0.313, 15(0):3.654|3.925, 17(0):8.172|8.245300, 147(0):3.024|3.230, 142(0):0.692|1.405, 16(0):0.265|0.300, 15(0):3.452|3.475, 14(0):8.518|9.214
 STOPPING THREADS..................................................
<Raw Results> -- 第一次统计结果[0] sc:4942 lt:0 rt:0 fl:0 -- New-Order,新订单业务成功(success,简写sc)次数,延迟(late,简写lt)次数,重试(retry,简写rt)次数,失败(failure,简写fl)次数[1] sc:4937 lt:0 rt:0 fl:0 -- Payment,支付业务统计[2] sc:495 lt:0 rt:0 fl:0 -- Order-Status,订单状态业务统计[3] sc:493 lt:0 rt:0 fl:0 -- Delivery,发货业务统计[4] sc:495 lt:0 rt:0 fl:0 -- Stock-Level,库存业务统计in 300 sec.
<Raw Results2(sum ver.)> -- 第二次统计结果[0] sc:4944 lt:0 rt:0 fl:0[1] sc:4940 lt:0 rt:0 fl:0[2] sc:495 lt:0 rt:0 fl:0[3] sc:493 lt:0 rt:0 fl:0[4] sc:495 lt:0 rt:0 fl:0
 <Constraint Check> (all must be [OK]) -- 下面所有业务逻辑结果都必须为 OK 才行[transaction percentage]Payment: 43.45% (>=43.0%) [OK]Order-Status: 4.36% (>= 4.0%) [OK]Delivery: 4.34% (>= 4.0%) [OK]Stock-Level: 4.36% (>= 4.0%) [OK][response time (at least 90% passed)]New-Order: 100.00% [OK]Payment: 100.00% [OK]Order-Status: 100.00% [OK]Delivery: 100.00% [OK]Stock-Level: 100.00% [OK]
 <TpmC>988.400 TpmC-- TpmC结果值(每分钟事务数,该值是第一次统计结果中的新订单事务数除以总耗时分钟数)
mysql> show variables like 'innodb_buffer_pool_size';+-------------------------+------------+| Variable_name | Value |+-------------------------+------------+| innodb_buffer_pool_size | 2147483648 |+-------------------------+------------+1 row in set (0.17 sec)
[root@mxqmongodb2 tpcc-mysql]# ./tpcc_start -h127.0.0.1 -P3306 -d tpcc -u root -p123456 -w 10 -c 50 -r 10 -l 120 >/home/sa/tpcc_output_2048.log
mysql> set global innodb_buffer_pool_size=134217728;
Query OK, 0 rows affected (0.05 sec)
mysql> show variables like 'innodb_buffer_pool_size';+-------------------------+------------+| Variable_name | Value |+-------------------------+------------+| innodb_buffer_pool_size | 134217728|+-------------------------+------------+1 row in set (0.01 sec)[root@mxqmongodb2 tpcc-mysql]# ./tpcc_start -h127.0.0.1 -P3306 -d tpcc -u root -p123456 -w 10 -c 50 -r 10 -l 1200 >/home/sa/tpcc_output_128.log
[root@mxqmongodb2 sa]# cat tpcc_output_128.log | grep '(0)' | grep -v HY000 | grep -v payment | grep -v neword | awk -F ':' '{print $1}' |awk -F ',' '{print $1 $2}'|sed 's/(0)//g'|sed 's/(1)//g'>tpcc_output_1128.txt[root@mxqmongodb2 sa]# cat tpcc_output_2048.log | grep '(0)' | grep -v HY000 | grep -v payment | grep -v neword | awk -F ':' '{print $1}' |awk -F ',' '{print $1 $2}'|sed 's/(0)//g'|sed 's/(1)//g'>tpcc_output_2048.txt
[root@mxqmongodb2 sa]# paste tpcc_output_128.txt tpcc_output_2048.txt > tpcc-graph-data128.txt[root@mxqmongodb2 sa]# ./tpcc-graph-build.sh tpcc-graph-data128.txt tpcc-graph128-2048.jpg
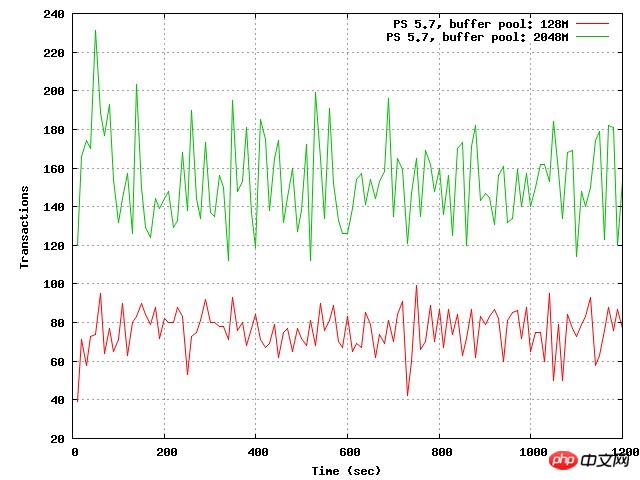
#!/bin/bash
### goto user homedir and remove previous filerm -f '$2'gnuplot << EOP
### set data source filedatafile = '$1'### set graph type and size
set terminal jpeg size 640,480### set titles
set grid x y
set xlabel "Time (sec)"set ylabel "Transactions"### set output filename
set output '$2'### build graph
# plot datafile with lines
plot datafile title "PS 5.7, buffer pool: 128M" with lines,datafile using 3:4 title "PS 5.7, buffer pool: 2048M" with lines axes x1y1
EOP
Ce qui précède est le contenu détaillé de. pour plus d'informations, suivez d'autres articles connexes sur le site Web de PHP en chinois!
 Quelles sont les techniques de test courantes ?
 Introduction aux commandes CLI
 Le rôle de c++ce pointeur
 Comment utiliser debug.exe
 es6 nouvelles caractéristiques
 Quel est le nom de cette voix modifiée ?
 Comment activer la même fonction de ville sur Douyin
 Quelles sont les vulnérabilités courantes de Tomcat ?


![[Web front-end] Démarrage rapide de Node.js](https://img.php.cn/upload/course/000/000/067/662b5d34ba7c0227.png)


