 interface Web
 js tutoriel
 Exemple de graphiques électroniques définissant la couleur des lignes de polyligne et la couleur des points de polyligne
Exemple de graphiques électroniques définissant la couleur des lignes de polyligne et la couleur des points de polyligne
Cet article présente principalement la méthode des echarts du plug-in jQuery pour définir la couleur des lignes polylignes et la couleur des points de ligne dans le graphique linéaire. Il analyse les compétences opérationnelles associées des echarts du plug-in jQuery à définir. le graphique linéaire sous forme d'exemples. Les amis qui en ont besoin peuvent s'y référer. J'espère qu'il pourra aider tout le monde.
1. Contexte du problème
Concevez un graphique linéaire, mais les graphiques n'utilisent pas les couleurs fournies avec le plug-in. Vous devez personnaliser les couleurs de. les lignes et les sommets
2. Implémenter le code source
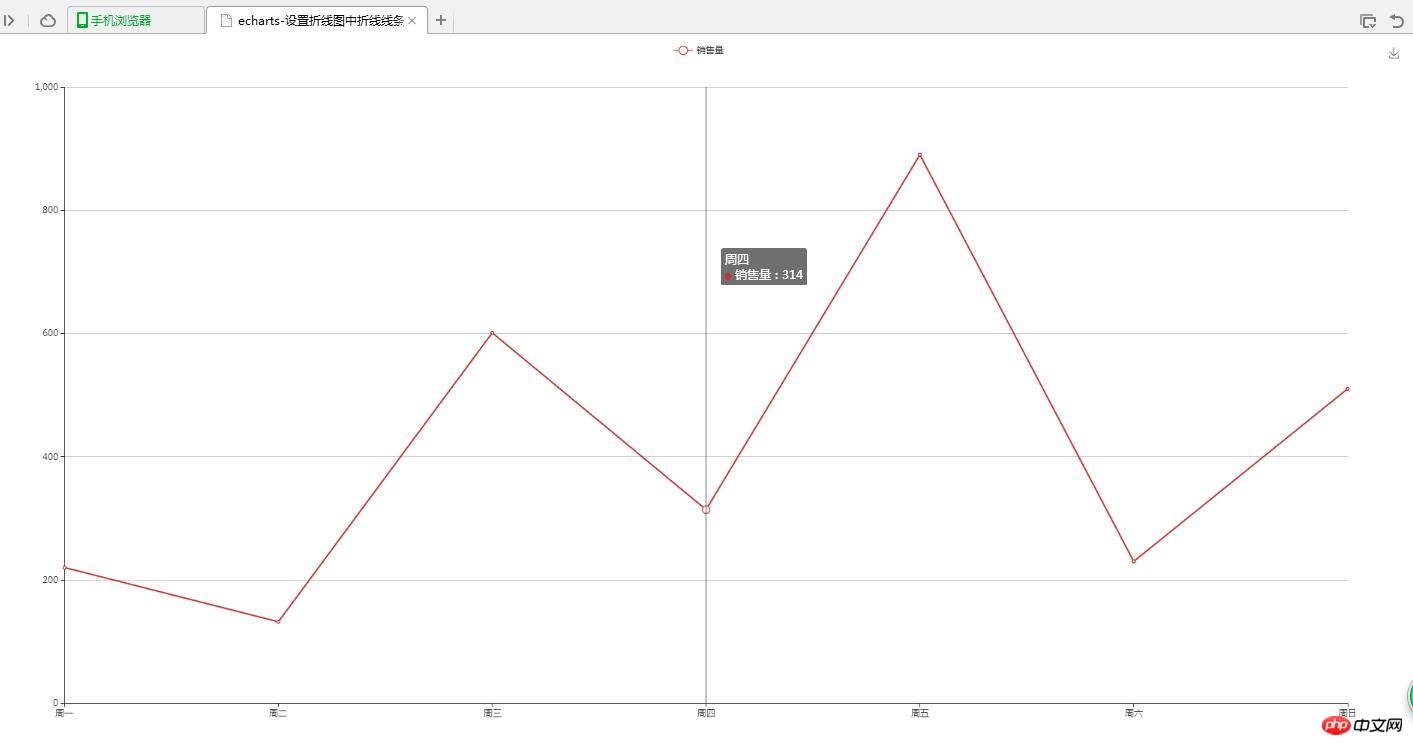
(1) Couleur auto-attribuée des graphiques
<!DOCTYPE html>
<html>
<head>
<meta charset="UTF-8">
<title>echarts-设置折线图中折线线条颜色和折线点颜色</title>
<link rel="shortcut icon" href="../js/echarts-2.2.7/doc/asset/ico/favicon.png" rel="external nofollow" rel="external nofollow" rel="external nofollow" >
<script type="text/javascript" src="../js/echarts-2.2.7/doc/asset/js/jquery.min.js" ></script>
<script type="text/javascript" src="../js/echarts-2.2.7/doc/example/www2/js/echarts-all.js" ></script>
<style>
body,html{
width: 99%;
height: 99%;
font-family: "微软雅黑";
font-size: 12px;
}
#line{
width: 100%;
height: 100%;
}
</style>
<script>
$(function(){
var chart = document.getElementById('line');
var echart = echarts.init(chart);
var option = {
title: {
text: ''
},
tooltip: {
trigger: 'axis'
},
legend: {
data:['销售量']
},
grid: {
left: '3%',
right: '4%',
bottom: '3%',
containLabel: true
},
toolbox: {
feature: {
saveAsImage: {}
}
},
xAxis: {
type: 'category',
boundaryGap: false,
data: ['周一','周二','周三','周四','周五','周六','周日']
},
yAxis: {
type: 'value'
},
series: [
{
name:'销售量',
type:'line',
stack: '销售量',
data:[220, 132, 601, 314, 890, 230, 510]
}
]
};
echart.setOption(option);
});
</script>
</head>
<body>
<p id="line"></p>
</body>
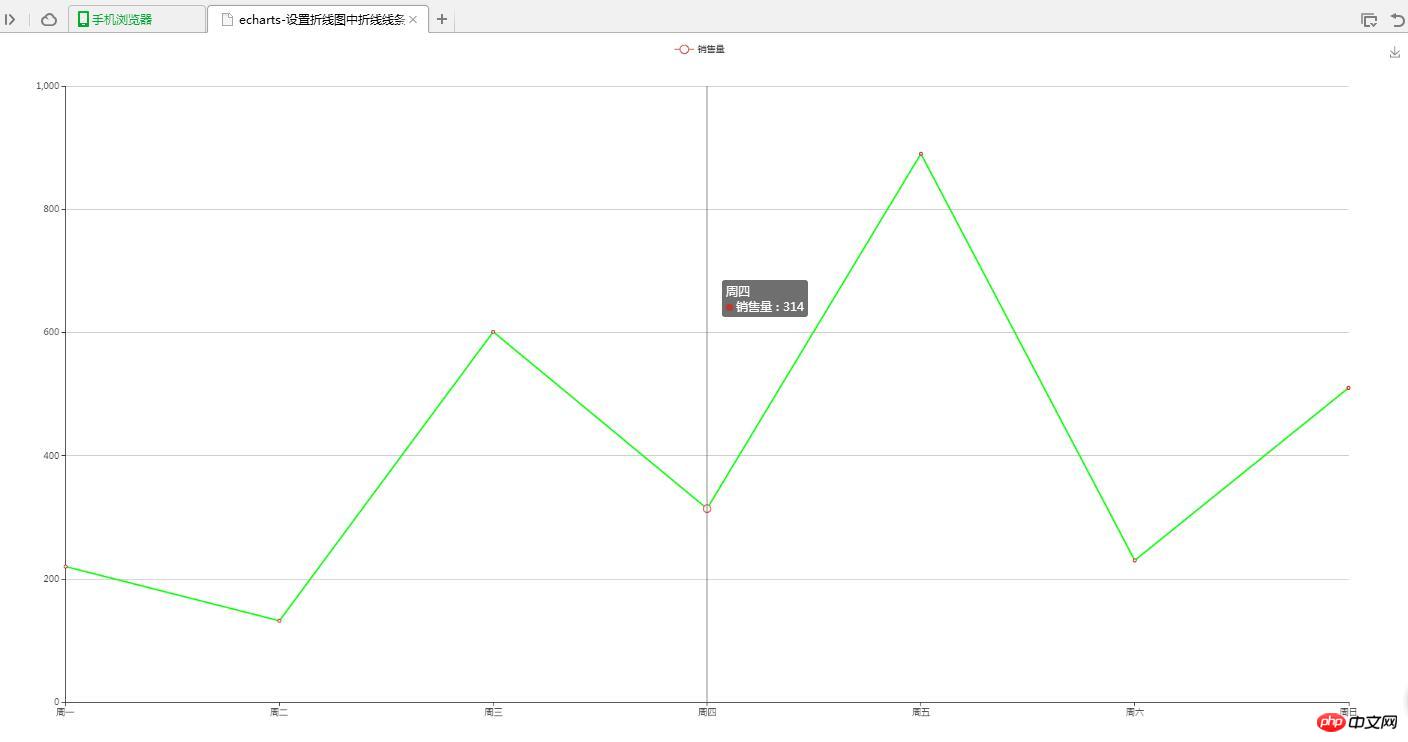
</html>(2) Couleur personnalisée de la ligne
<!DOCTYPE html>
<html>
<head>
<meta charset="UTF-8">
<title>echarts-设置折线图中折线线条颜色和折线点颜色</title>
<link rel="shortcut icon" href="../js/echarts-2.2.7/doc/asset/ico/favicon.png" rel="external nofollow" rel="external nofollow" rel="external nofollow" >
<script type="text/javascript" src="../js/echarts-2.2.7/doc/asset/js/jquery.min.js" ></script>
<script type="text/javascript" src="../js/echarts-2.2.7/doc/example/www2/js/echarts-all.js" ></script>
<style>
body,html{
width: 99%;
height: 99%;
font-family: "微软雅黑";
font-size: 12px;
}
#line{
width: 100%;
height: 100%;
}
</style>
<script>
$(function(){
var chart = document.getElementById('line');
var echart = echarts.init(chart);
var option = {
title: {
text: ''
},
tooltip: {
trigger: 'axis'
},
legend: {
data:['销售量']
},
grid: {
left: '3%',
right: '4%',
bottom: '3%',
containLabel: true
},
toolbox: {
feature: {
saveAsImage: {}
}
},
xAxis: {
type: 'category',
boundaryGap: false,
data: ['周一','周二','周三','周四','周五','周六','周日']
},
yAxis: {
type: 'value'
},
series: [
{
name:'销售量',
type:'line',
stack: '销售量',
itemStyle : {
normal : {
lineStyle:{
 color:'#00FF00'
}
}
},
data:[220, 132, 601, 314, 890, 230, 510]
}
]
};
echart.setOption(option);
});
</script>
</head>
<body>
<p id="line"></p>
</body>
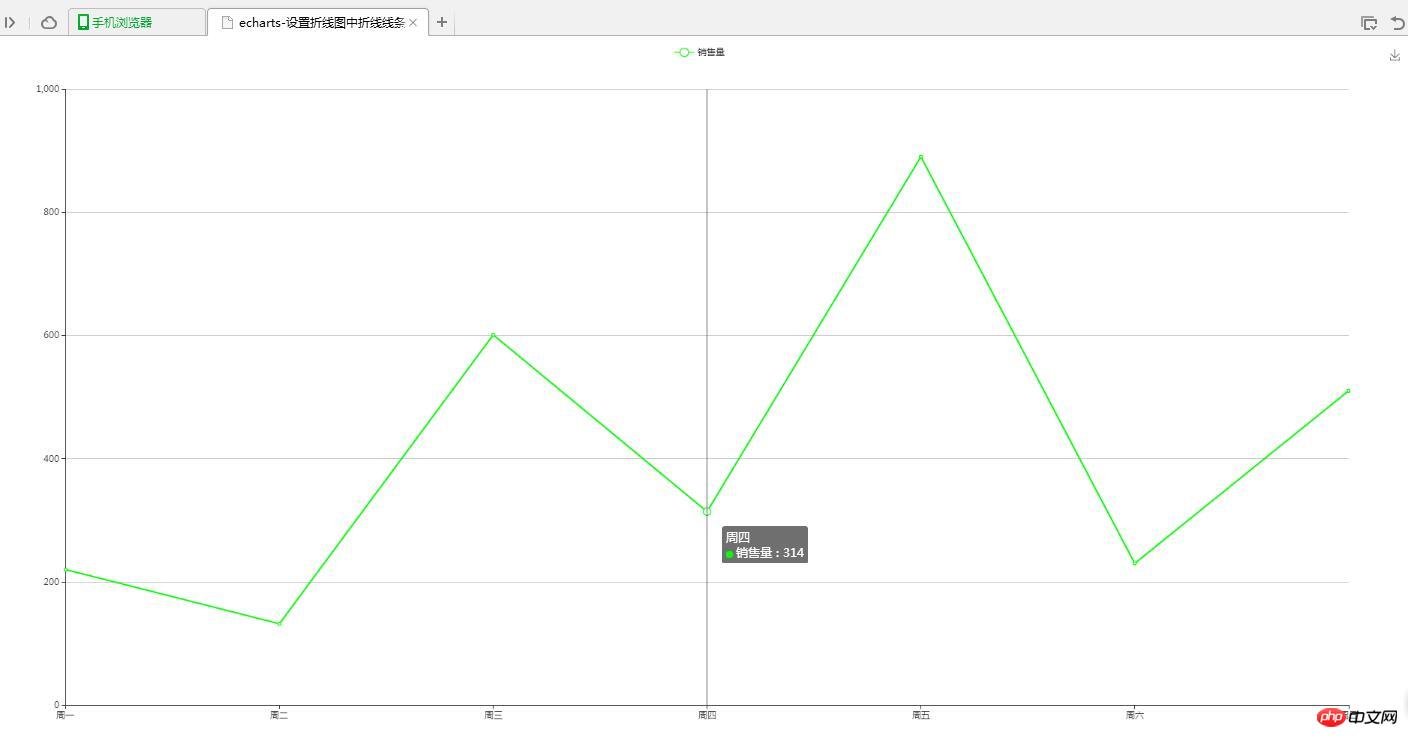
</html>(3) Couleur personnalisée du sommet
<!DOCTYPE html>
<html>
<head>
<meta charset="UTF-8">
<title>echarts-设置折线图中折线线条颜色和折线点颜色</title>
<link rel="shortcut icon" href="../js/echarts-2.2.7/doc/asset/ico/favicon.png" rel="external nofollow" rel="external nofollow" rel="external nofollow" >
<script type="text/javascript" src="../js/echarts-2.2.7/doc/asset/js/jquery.min.js" ></script>
<script type="text/javascript" src="../js/echarts-2.2.7/doc/example/www2/js/echarts-all.js" ></script>
<style>
body,html{
width: 99%;
height: 99%;
font-family: "微软雅黑";
font-size: 12px;
}
#line{
width: 100%;
height: 100%;
}
</style>
<script>
$(function(){
var chart = document.getElementById('line');
var echart = echarts.init(chart);
var option = {
title: {
text: ''
},
tooltip: {
trigger: 'axis'
},
legend: {
data:['销售量']
},
grid: {
left: '3%',
right: '4%',
bottom: '3%',
containLabel: true
},
toolbox: {
feature: {
saveAsImage: {}
}
},
xAxis: {
type: 'category',
boundaryGap: false,
data: ['周一','周二','周三','周四','周五','周六','周日']
},
yAxis: {
type: 'value'
},
series: [
{
name:'销售量',
type:'line',
stack: '销售量',
itemStyle : {
normal : {
color:'#00FF00',
lineStyle:{
color:'#00FF00'
}
}
},
data:[220, 132, 601, 314, 890, 230, 510]
}
]
};
echart.setOption(option);
});
</script>
</head>
<body>
<p id="line"></p>
</body>
</html>3. Résultats de la mise en œuvre
(1) Couleur auto-attribuée du graphique

(2) Couleur personnalisée de la ligne

(3) Couleur personnalisée du sommet

4. Description du problème
(1) Définir la couleur de la ligne de polyligne
lineStyle:{
color:'#00FF00'
}(2) Définir la couleur du sommet de la polyligne
itemStyle : {
 normal : {
  color:'#00FF00'
 }
}Connexe Recommandé :
Exemple de partage de génération de boucles effet graphique implémenté par echarts
Ce qui précède est le contenu détaillé de. pour plus d'informations, suivez d'autres articles connexes sur le site Web de PHP en chinois!

Outils d'IA chauds

Undresser.AI Undress
Application basée sur l'IA pour créer des photos de nu réalistes

AI Clothes Remover
Outil d'IA en ligne pour supprimer les vêtements des photos.

Undress AI Tool
Images de déshabillage gratuites

Clothoff.io
Dissolvant de vêtements AI

Video Face Swap
Échangez les visages dans n'importe quelle vidéo sans effort grâce à notre outil d'échange de visage AI entièrement gratuit !

Article chaud

Outils chauds

Bloc-notes++7.3.1
Éditeur de code facile à utiliser et gratuit

SublimeText3 version chinoise
Version chinoise, très simple à utiliser

Envoyer Studio 13.0.1
Puissant environnement de développement intégré PHP

Dreamweaver CS6
Outils de développement Web visuel

SublimeText3 version Mac
Logiciel d'édition de code au niveau de Dieu (SublimeText3)
 Comment utiliser l'interface PHP et ECharts pour générer des graphiques statistiques visuels
Dec 18, 2023 am 11:39 AM
Dans le contexte actuel où la visualisation des données devient de plus en plus importante, de nombreux développeurs espèrent utiliser divers outils pour générer rapidement divers graphiques et rapports afin de pouvoir mieux afficher les données et aider les décideurs à prendre des décisions rapides. Dans ce contexte, l'utilisation de l'interface Php et de la bibliothèque ECharts peut aider de nombreux développeurs à générer rapidement des graphiques statistiques visuels. Cet article présentera en détail comment utiliser l'interface Php et la bibliothèque ECharts pour générer des graphiques statistiques visuels. Dans l'implémentation spécifique, nous utiliserons MySQL
 Comment changer la couleur de la barre des tâches de Windows 10
Jan 01, 2024 pm 09:05 PM
Il est très simple de modifier la couleur de la barre des tâches Win10, mais de nombreux utilisateurs constatent qu'ils ne peuvent pas la définir. En fait, c'est très simple. Choisissez simplement votre couleur préférée dans la personnalisation de l'ordinateur. Si vous ne pouvez pas changer la couleur, faites attention. aux paramètres détaillés. Comment changer la couleur de la barre des tâches win10 Étape 1 : Faites un clic droit sur le bureau - cliquez sur Personnaliser Étape 2 : Personnalisez la zone de couleur Étape 3 : Choisissez votre couleur préférée PS : Si vous ne pouvez pas changer la couleur, vous pouvez cliquer sur Couleur -> Sélectionnez Couleur -> Personnaliser-> Mode Windows par défaut, sélectionnez la couleur sombre.
 Étapes pour dessiner un tableau de bord à l'aide de l'interface ECharts et Python
Dec 18, 2023 am 08:40 AM
Les étapes pour dessiner un tableau de bord à l'aide d'ECharts et de l'interface Python nécessitent des exemples de code spécifiques Résumé : ECharts est un excellent outil de visualisation de données qui peut facilement effectuer le traitement des données et le dessin graphique via l'interface Python. Cet article présentera les étapes spécifiques pour dessiner un tableau de bord à l'aide d'ECharts et de l'interface Python, et fournira un exemple de code. Mots clés : ECharts, interface Python, tableau de bord, visualisation de données Introduction Le tableau de bord est une forme couramment utilisée de visualisation de données, qui utilise
 Comment utiliser la carte thermique pour afficher la chaleur de la ville dans ECharts
Dec 18, 2023 pm 04:00 PM
Comment utiliser une carte thermique pour afficher la chaleur de la ville dans ECharts ECharts est une puissante bibliothèque de graphiques visuels qui fournit différents types de graphiques que les développeurs peuvent utiliser, y compris des cartes thermiques. Les cartes thermiques peuvent être utilisées pour montrer la popularité des villes ou des régions, nous aidant ainsi à comprendre rapidement la popularité ou la densité de différents lieux. Cet article explique comment utiliser la carte thermique dans ECharts pour afficher la chaleur de la ville et fournit des exemples de code à titre de référence. Tout d'abord, nous avons besoin d'un fichier cartographique contenant des informations géographiques, EC
 Nouvelle mémoire de la série X100 de Vivo, exposition des couleurs : toutes les séries commencent à 12+256 Go
May 06, 2024 pm 03:58 PM
Selon les informations du 6 mai, Vivo a officiellement annoncé aujourd'hui que la nouvelle série VivoX100 serait officiellement lancée à 19h00 le 13 mai. Il est entendu que cette conférence devrait lancer trois modèles, vivoX100s, vivoX100sPro et vivoX100Ultra, ainsi que la technologie d'imagerie Blueprint de la marque d'imagerie auto-développée par Vivo. Le blogueur numérique « Digital Chat Station » a également publié aujourd'hui les rendus officiels, les spécifications de mémoire et la correspondance des couleurs de ces trois modèles. Parmi eux, le X100 adopte un design d'écran droit, tandis que le X100sPro et le X100Ultra ont un design d'écran incurvé. Le blogueur a révélé que le vivoX100 est disponible en quatre couleurs : noir, titane, cyan et blanc. Les spécifications de la mémoire.
 Comment utiliser des graphiques de calendrier pour afficher des données temporelles dans ECharts
Dec 18, 2023 am 08:52 AM
Comment utiliser des graphiques de calendrier pour afficher des données temporelles dans ECharts ECharts (la bibliothèque de graphiques JavaScript open source de Baidu) est un outil de visualisation de données puissant et facile à utiliser. Il propose une variété de types de graphiques, notamment des graphiques linéaires, des graphiques à barres, des diagrammes circulaires, etc. Le graphique calendaire est un type de graphique très distinctif et pratique dans ECharts, qui peut être utilisé pour afficher des données liées au temps. Cet article explique comment utiliser les graphiques de calendrier dans ECharts et fournit des exemples de code spécifiques. Tout d'abord, vous devez utiliser
 Savez-vous comment définir la couleur du tableau des documents WPS ?
Mar 20, 2024 am 08:19 AM
Lorsque nous voyons les couleurs des tableaux dans les documents WPS d'autres personnes, les effets sont colorés et magnifiques, mais nous n'avons qu'un noir monotone. Si vous devez remplir la table de couleurs, je pense que de nombreux étudiants le feront. Cependant, si vous souhaitez définir la couleur du tableau dans le document WPS Chine, de nombreux étudiants trouveront certainement cela déroutant ! Aujourd'hui, apprenons à définir la couleur du tableau des documents WPS. J'ai rédigé un document qui, je l'espère, sera utile à tout le monde. Les étapes sont les suivantes : 1. Nous devons dessiner un tableau dans le document WPS et cliquer avec le bouton droit sur le tableau où la couleur de la ligne doit être modifiée. 2. Ensuite, utilisez la souris pour cliquer [bouton droit de la souris] sur le tableau ; dans le menu contextuel, nous trouvons [Bordure et ombrage]. 3. À ce moment, l'option [Bordure et ombrage] sera ouverte.
 Comment résoudre le problème de couleur anormale du moniteur Win7
Jan 14, 2024 pm 06:54 PM
Nous savons que les ordinateurs rencontreront divers problèmes après une utilisation prolongée. Le plus courant est le problème du moniteur. De nombreux utilisateurs ont rencontré des couleurs de moniteur anormales. Alors, que devez-vous faire si vous rencontrez également des couleurs de moniteur anormales dans Win7 ? Jetons un coup d'œil à la solution. Que faire si le moniteur Win7 présente des couleurs anormales : Les phénomènes courants de défaillance du moniteur sont les suivants : 1. Il n'y a aucun affichage lors de la mise sous tension de l'ordinateur et le moniteur ne s'allume souvent pas. 2. Les caractères sur l'écran du moniteur sont flous. 3. Le moniteur présente des taches de couleur. 4. Des rayures colorées ondulées apparaissent sur le moniteur. 5. Le moniteur dégage une odeur particulière. 6. Le moniteur émet un son « pop » continu. 7. Sous certaines applications ou configurations, l'écran peut devenir flou, sombre (voire noir), fantôme ou figé, etc. 8. L’affichage manque de couleur, est flou, l’écran est trop lumineux ou


