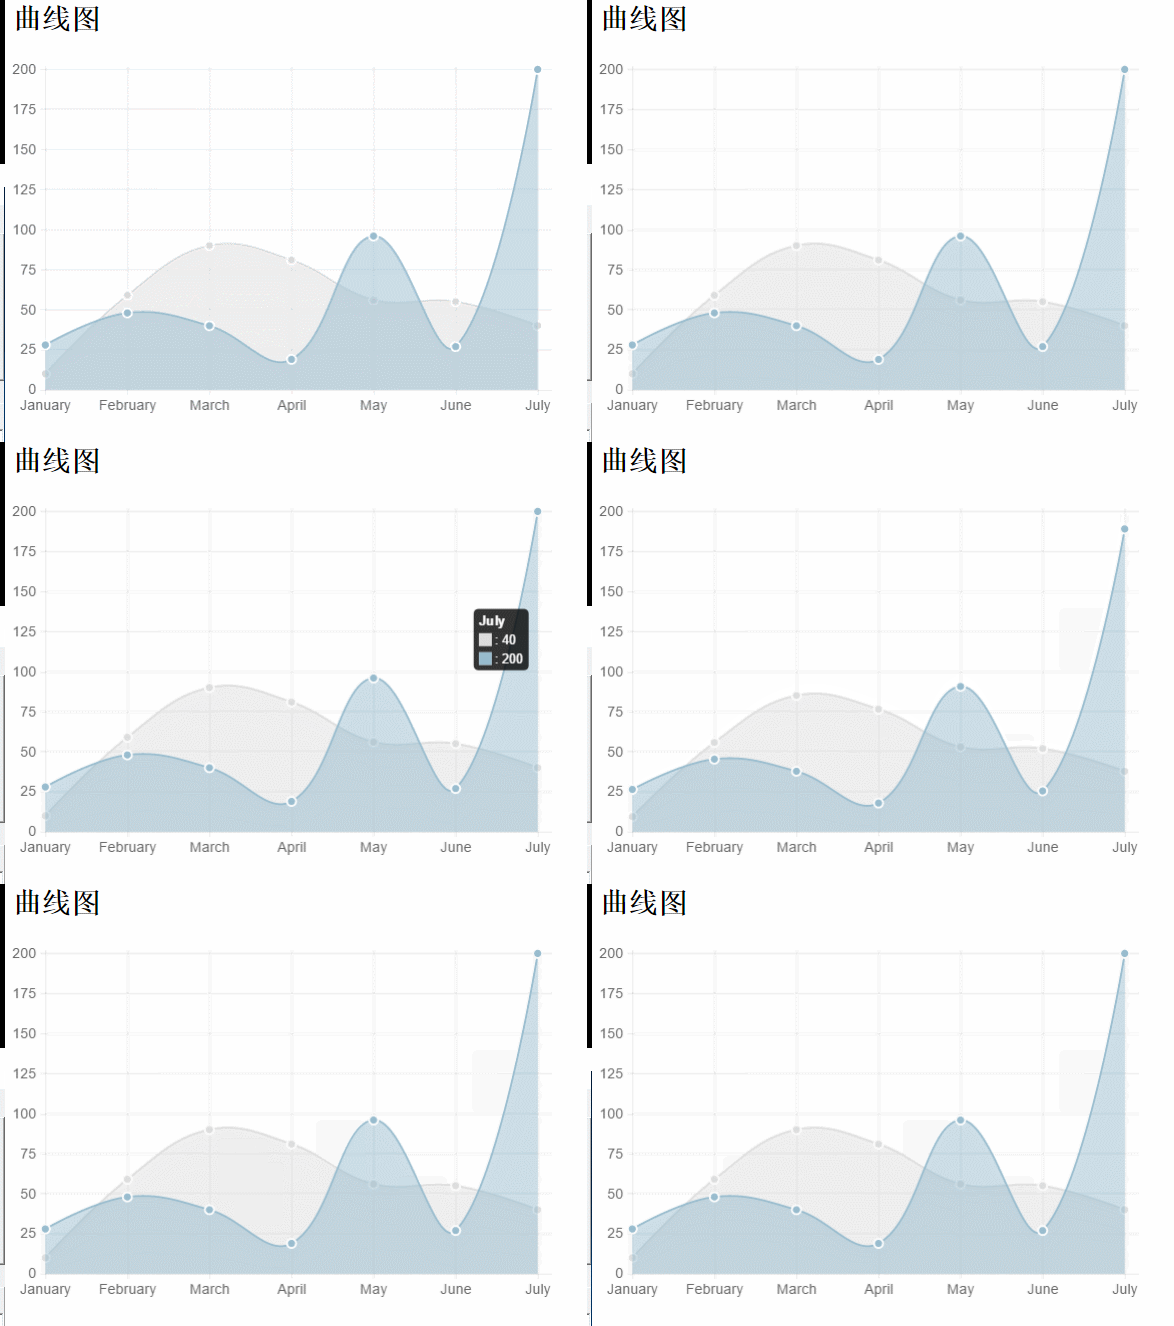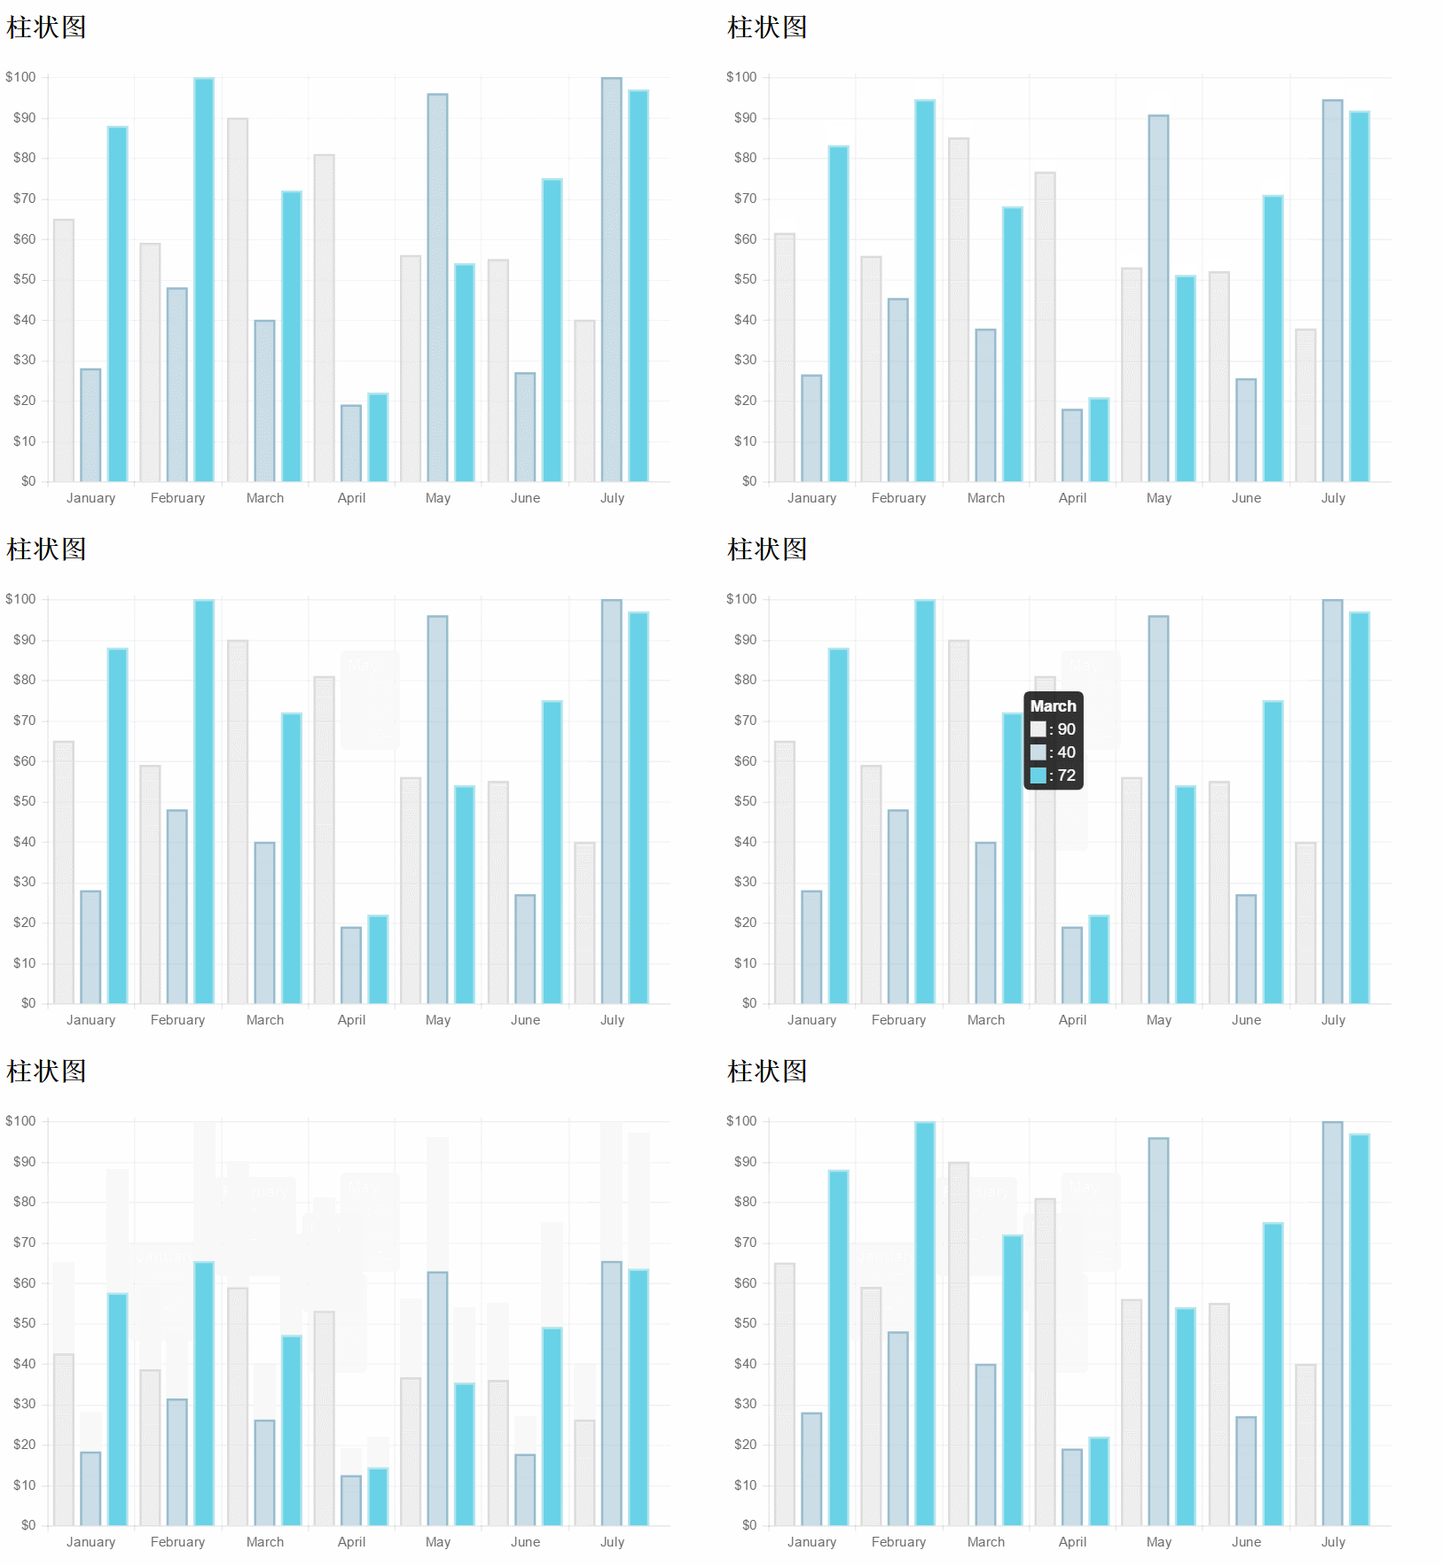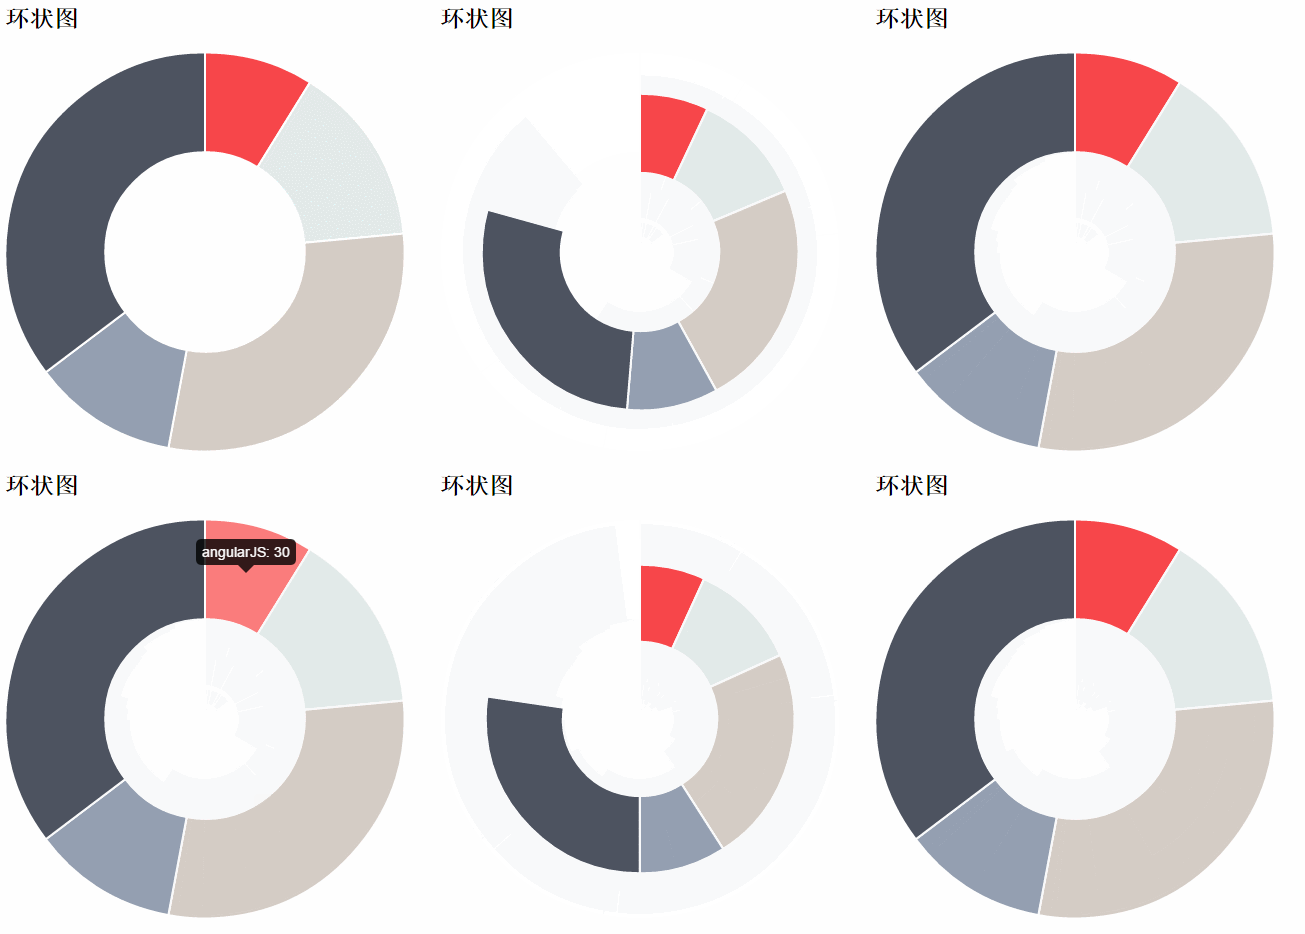
Cette fois, je vous apporte une explication détaillée de la façon d'utiliser la bibliothèque d'outils de dessin de graphiques HTML5 légers Chart.js. Quelles sont les précautions lors de l'utilisation de la bibliothèque d'outils de dessin de graphiques HTML5 légers Chart.js. Voici la pratique réelle. Jetons un coup d’œil au cas.
Étapes :
partie HTML :
<canvas id="myChart" width="400" height="400"></canvas>
partie javascript :
Introduire le graphique. js;
Créer un graphique : instancier l'objet Chart (récupérer le nœud DOM et obtenir l'environnement de contexte 2D et l'instancier
Graphique linéaire :
html ; :<canvas id="myChart" width="600" height="400"></canvas>
<script src="js/Chart.min.js"></script>
<script type="text/javascript">
 //方式一:
 var ctx = document.getElementById("myChart").getContext("2d");;
 var MyNewChart = new Chart(ctx).Line(data); //这种方式是只加载数据集,(缺省options)不修改默认参数(简称法一)
 //数据结构(数据参数设置)
 var data = {
 //折线图需要为每个数据点设置一标签。这是显示在X轴上。
 labels: ["January", "February", "March", "April", "May", "June", "July"],
 //数据集(y轴数据范围随数据集合中的data中的最大或最小数据而动态改变的)
 datasets: [{
   fillColor: "rgba(220,220,220,0.5)", //背景填充色
   strokeColor: "rgba(220,220,220,1)", //路径颜色
   pointColor: "rgba(220,220,220,1)", //数据点颜色
   pointStrokeColor: "#fff", //数据点边框颜色
   data: [10, 59, 90, 81, 56, 55, 40] //对象数据
  }, {
   fillColor: "rgba(151,187,205,0.5)",
   strokeColor: "rgba(151,187,205,1)",
   pointColor: "rgba(151,187,205,1)",
   pointStrokeColor: "#fff",
   data: [28, 48, 40, 19, 96, 27, 200]
  }]
  };
</script>//数据结构(数据参数设置)
var data = {
//折线图需要为每个数据点设置一标签。这是显示在X轴上。
labels: ["January", "February", "March", "April", "May", "June", "July"],
//数据集(y轴数据范围随数据集合中的data中的最大或最小数据而动态改变的)
datasets: [{
fillColor: "rgba(220,220,220,0.5)", //背景填充色
strokeColor: "rgba(220,220,220,1)", //路径颜色
pointColor: "rgba(220,220,220,1)", //数据点颜色
pointStrokeColor: "#fff", //数据点边框颜色
data: [10, 59, 90, 81, 56, 55, 40] //对象数据
}, {
fillColor: "rgba(151,187,205,0.5)",
strokeColor: "rgba(151,187,205,1)",
pointColor: "rgba(151,187,205,1)",
pointStrokeColor: "#fff",
data: [28, 48, 40, 19, 96, 27, 200]
}]
};
Line.defaults = {
  //网格线是否在数据线的上面
  scaleOverlay : false,
  //是否用硬编码重写y轴网格线
  scaleOverride : false,
  //** Required if scaleOverride is true **
  //y轴刻度的个数
  scaleSteps : null,
  //y轴每个刻度的宽度
  scaleStepWidth : 20,
  // Y 轴的起始值
  scaleStartValue : null,
  // Y/X轴的颜色
  scaleLineColor: "rgba(0,0,0,.1)",
  // X,Y轴的宽度
  scaleLineWidth: 1,
  // 刻度是否显示标签, 即Y轴上是否显示文字
  scaleShowLabels: true,
  // Y轴上的刻度,即文字
  scaleLabel: "<%=value%>",
  // 字体
  scaleFontFamily: "'Arial'",
  // 文字大小
  scaleFontSize: 16,
  // 文字样式
  scaleFontStyle: "normal",
  // 文字颜色
  scaleFontColor: "#666",
  // 是否显示网格
  scaleShowGridLines: true,
  // 网格颜色
  scaleGridLineColor: "rgba(0,0,0,.05)",
  // 网格宽度
  scaleGridLineWidth:2,
  // 是否使用贝塞尔曲线? 即:线条是否弯曲
  bezierCurve: true,
  // 是否显示点数
  pointDot: true,
  // 圆点的大小
  pointDotRadius:5,
  // 圆点的笔触宽度, 即:圆点外层白色大小
  pointDotStrokeWidth: 2,
  // 数据集行程(连线路径)
  datasetStroke: true,
  // 线条的宽度, 即:数据集
  datasetStrokeWidth: 2,
  // 是否填充数据集
  datasetFill: true,
  // 是否执行动画
  animation: true,
  // 动画的时间
  animationSteps: 60,
  // 动画的特效
  animationEasing: "easeOutQuart",
  // 动画完成时的执行函数
  /*onAnimationComplete: null*/
}(Indique que je viens d'entrer en contact avec Chart.js. J'étais confus quand j'ai vu les paramètres du graphique, et tout le processus a été commenté en anglais, haha~)
Après avoir compris les paramètres du graphique, vous pouvez personnaliser les paramètres du graphique. Jetons un coup d'œil aux exemples d'utilisation spécifiques : La partie HTML et la partie d'introduction du fichier js sont omises : (Les types de graphiques suivants sont également omis !)<script type="text/javascript">
//同样数据参数设置
var data = {
//折线图需要为每个数据点设置一标签。这是显示在X轴上。
labels: ["January", "February", "March", "April", "May", "June", "July"],
//这边的thisId分别对应labels的id
thisIds : [12,22,50,44,99,3,67],
//数据集(y轴数据范围随数据集合中的data中的最大或最小数据而动态改变的)
datasets: [{
fillColor: "rgba(220,220,220,0.5)", //背景填充色
strokeColor: "rgba(220,220,220,1)", //路径颜色
pointColor: "rgba(220,220,220,1)", //数据点颜色
pointStrokeColor: "#fff", //数据点边框颜色
data: [10, 59, 90, 81, 56, 55, 40] //对象数据
}, {
fillColor: "rgba(151,187,205,0.5)",
strokeColor: "rgba(151,187,205,1)",
pointColor: "rgba(151,187,205,1)",
pointStrokeColor: "#fff",
data: [28, 48, 40, 19, 96, 27, 200]
}]
};
window.onload = function() {
var ctx = document.getElementById("myChart").getContext("2d");;
//方式二:传入对象字面量去修改默认图标参数,自定义图表
var MyNewChart = new Chart(ctx).Line(data, {
// 网格颜色
scaleGridLineColor: "rgba(255,0,0,1)",
// Y/X轴的颜色
scaleLineColor: "rgba(0,0,0,.1)",
// 文字大小
scaleFontSize: 16,
// 文字颜色
scaleFontColor: "#666",
// 网格颜色
scaleGridLineColor: "rgba(0,0,0,.05)",
// 是否使用贝塞尔曲线? 即:线条是否弯曲
// 是否执行动画
animation: true,
// 动画的时间
animationSteps: 60,
// 动画完成时的执行函数
onAnimationComplete: function(){
console.log("给x轴的lable对应的id:");
console.log(data.thisIds);
}
});
}
</script>
Graphique à barres :
new Chart(ctx).Bar(data,options);//简记,options可缺省
var data = {
 labels : ["January","February","March","April","May","June","July"],
 datasets : [
 {
  fillColor : "rgba(220,220,220,0.5)",
  strokeColor : "rgba(220,220,220,1)",
  data : [65,59,90,81,56,55,40]
 },
 {
  fillColor : "rgba(151,187,205,0.5)",
  strokeColor : "rgba(151,187,205,1)",
  data : [28,48,40,19,96,27,100]
 }
 ]
}Bar.defaults = {
//网格线是否在数据线的上面
scaleOverlay : false,
//是否用硬编码重写y轴网格线
scaleOverride : false,
//** Required if scaleOverride is true **
//y轴刻度的个数
scaleSteps : null,
//y轴每个刻度的宽度
scaleStepWidth : null,
//Y轴起始值
scaleStartValue: null,
// Y/X轴的颜色
scaleLineColor: "rgba(0,0,0,.1)",
// X,Y轴的宽度
scaleLineWidth: 1,
// 刻度是否显示标签, 即Y轴上是否显示文字
scaleShowLabels: false,
// Y轴上的刻度,即文字
scaleLabel: "<%=value%>",
// 字体
scaleFontFamily: "'Arial'",
// 文字大小
scaleFontSize: 12,
// 文字样式
scaleFontStyle: "normal",
// 文字颜色
scaleFontColor: "#666",
// 是否显示网格
scaleShowGridLines: true,
// 网格颜色
scaleGridLineColor: "rgba(0,0,0,.05)",
// 网格宽度
scaleGridLineWidth: 1,
//Bar Chart图表特定参数:
//是否绘制柱状条的边框
barShowStroke : true,
//柱状条边框的宽度
barStrokeWidth : 2,
//柱状条组之间的间距(过大或过小会出现重叠偏移错位的效果,请控制合理数值)
barValueSpacing :5,
//每组柱状条组中柱状条之间的间距
barDatasetSpacing :5,
// 是否显示提示
showTooltips: true,
// 是否执行动画
animation: true,
// 动画的时间
animationSteps: 60,
// 动画的特效
animationEasing: "easeOutQuart",
// 动画完成时的执行函数
onAnimationComplete: null
}var barChart = new Chart(ctx).Bar(data, {
scaleLabel: "$"+"<%=value%>",
//是否绘制柱状条的边框
barShowStroke: true,
//柱状条边框的宽度
barStrokeWidth: 2,
//柱状条组之间的间距(过大或过小会出现重叠偏移错位的效果,请控制合理数值)
barValueSpacing: 5,
//每组柱状条组中柱状条之间的间距
barDatasetSpacing: 5,
});
Graphique circulaire :
javascript :new Chart(ctx).Pie(data,options);
var data=[
  {
  value:40,
  color:"#21F0EA",//背景色
  highlight:"#79E8E5",//高亮背景颜色
  label:'javascript'//文字标签
  },{
  value:60,
  color:"#E0E4CC",
  highlight:"#EAEDD8",
  label:'jquery'
  },{
  value:100,
  color:"#69D2E7",
  highlight:"#83E5F7",
  label:'html'
  }
];Pie.defaults = {
//是否显示每段行程(即扇形区,不为true则无法看到后面设置的边框颜色)
segmentShowStroke : true,
//设置每段行程的边框颜色
segmentStrokeColor : "red",
//心啊是每段扇区边框的宽度
segmentStrokeWidth :2,
//Boolean - 是否执行动画
animation : true,
//Number - 动画时间
animationSteps : 100,
//String - 动画的效果
animationEasing : "easeOutBounce",
//Boolean -是否旋转动画
animateRotate : true,
//Boolean - 是否动画缩放饼图中心(效果不错)
animateScale : true,
//Function - 火动画完成时执行的函数
onAnimationComplete : null
}var ctx=document.getElementById("pieChart").getContext("2d");
window.pieChart=new Chart(ctx).Pie(data,{
//是否显示每段行程(即扇形区,不为true则无法看到后面设置的边框颜色)
segmentShowStroke : true,
//设置每段行程的边框颜色
segmentStrokeColor : "red",
//每段扇区边框的宽度
segmentStrokeWidth :2,
//Boolean - 是否执行动画
animation : true,
//Number - 动画时间
animationSteps : 100,
//String - 动画的效果
animationEasing : "easeOutBounce",
//Boolean -是否旋转动画
animateRotate : true,
//Boolean - 是否动画缩放饼图中心(效果不错)
animateScale : true,
//Function - 动画完成时执行的函数
//onAnimationComplete : null
});
Graphique en anneau :
javascript :new Chart(ctx).Doughnut(data,options);
//数据结构(与饼图相似)
  var data = [{
  value: 30,
  color: "#F7464A",
  highlight: "#FA7C7C",
  label: "angularJS"
  }, {
  value: 50,
  color: "#E2EAE9",
  highlight: "#F2F5F5",
  label: "juqery"
  }, {
  value: 100,
  color: "#D4CCC5",
  hightlight: "#DBD6D1",
  label: "javascript"
  }, {
  value: 40,
  color: "#949FB1",
  highlight: "#AFBCCE",
  label: "nodeJS"
  }, {
  value: 120,
  color: "#4D5360",
  highlight: "#767C86",
  label: "html"
  }];
Doughnut.defaults={
   //是否显示每段行程(即环形区,不为true则无法看到后面设置的边框颜色)
   segmentShowStroke: true,
   //设置每段行程的边框颜色
   segmentStrokeColor: "#fff",
   //设置每段环形的边框宽度
   segmentStrokeWidth: 2,
   //图标中心剪切圆的比例(0为饼图,接近100则环形宽度越小)
   percentageInnerCutout: 50,
   //是否执行动画
   animation: true,
   //执行动画时间
   animationSteps: 100,
   //动画特效
   animationEasing: "easeOutBounce",
   //是否旋转动画
   animateRotate: true,
   //是否缩放图表中心
   animateScale: true,
   //动画完成时的回调函数
//   onAnimationComplete: null
  }
<h2>柱状图</h2>
<canvas id="barChart" width="400" height="300"></canvas>
<!--这里添加了用来放置图例的p标签-->
<p id="legend"></p>
 <style>
  ul,li{
  list-style-type:none;;
  }
  ul>li{
  margin:5px auto;
  font-family: "微软雅黑";
  }
  span{
  display: inline-block;
  width:20px;height:20px;line-height: 20px;
  vertical-align:middle;
  margin-right:5px;
  }
</style>window.onload = function() {
var ctx = document.getElementById("barChart").getContext("2d");
var barChart = new Chart(ctx).Bar(data, {
showTooltips: false, // 是否显示提示,这里需要设置为false
//模板
legendTemplate:
'<ul class=\"<%=name.toLowerCase()%>-legend\">'+
'<% for (var i=0; i<datasets.length; i++){%>'+
'<li><span style=\"background-color:<%=datasets[i].fillColor%>\"></span>'+
'<%if(datasets[i].label){%><%=datasets[i].label%><%}%></li>'+
'<%}%>'+
'</ul>',
onAnimationComplete: function() {//动画完成后显示对应的数据
var ctx = this.chart.ctx;
ctx.font = this.scale.font;
ctx.fillStyle = this.scale.textColor;
ctx.textAlign = 'center';
ctx.textBaseline = 'bottom';
this.datasets.forEach(function(dataset) {
dataset.bars.forEach(function(bar) {
ctx.fillText(bar.value, bar.x, bar.y);
});
});
}
});
var legend = document.getElementById('legend');
// 图例
legend.innerHTML = barChart.generateLegend();
}
//数据结构:
var data = {
labels: ["一月", "二月", "三月", "四月", "五月", "六月", "七月"],
datasets: [{
fillColor: "rgba(220,220,220,0.5)",
strokeColor: "rgba(220,220,220,1)",
data: [65, 59, 90, 81, 56, 55, 40],
label: "本月销售额"//图例标签
},{
fillColor: "#69D2E7",
strokeColor: "#B2E5ED",
data: [54, 99, 72, 61, 86, 65, 84],
label: "本季度销售额"
}]
};
Comment utiliser PHP pour implémenter la reconnaissance faciale et la connexion faciale pour les mini-programmes WeChat
Comment pour résoudre rapidement jQuery Envoyez une demande de transmission de paramètres chinois tronqués
Ce qui précède est le contenu détaillé de. pour plus d'informations, suivez d'autres articles connexes sur le site Web de PHP en chinois!