 interface Web
 js tutoriel
 Implémentez la fonction top en utilisant vue2-highcharts dans Vue (tutoriel détaillé)
Implémentez la fonction top en utilisant vue2-highcharts dans Vue (tutoriel détaillé)
Maintenant, je vais partager avec vous un exemple d'utilisation de vue2-highcharts pour implémenter la fonction top dans Vue. Il a une bonne valeur de référence et j'espère qu'il sera utile à tout le monde.
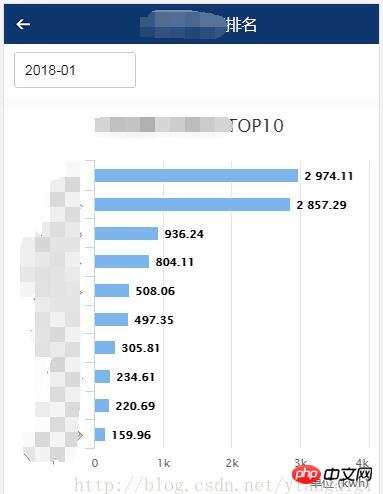
1. L'effet à obtenir est le suivant :

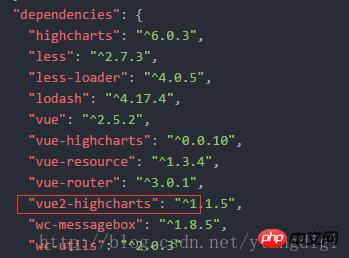
2. Tout d'abord, le projet fait référence à vue2-highcharts
package.json comme suit :

Entrez dans la ligne de commande :
cnpm install vue2-highcharts
3. Le code de la page est le suivant :
<template>
<p >
<p>
<p id="transparent-header" class="rank-head container" >
<img src="../assets/index/back.png" class="rank-head-back" @click="routerBack"/>
<span >用能排名</span>
</p>
</p>
<p >
<p >
<datepicker v-on:picked="picked" style="margin-left:10px;"></datepicker>
</p>
<p >
</p>
</p>
<p >
<p class="charts">
<vue-highcharts :options="options" ref="maxLineCharts"></vue-highcharts>
</p>
</p>
<p >
<p class="charts">
<vue-highcharts :options="options" ref="minLineCharts"></vue-highcharts>
</p>
</p>
</p>
</template>
<script>
import datepicker from '../components/datepicker.vue'
import VueHighcharts from 'vue2-highcharts'
export default {
data() {
return{
topHeight:240,
freezeMon:'',
ownerFreeData: [],
options:{
credits: {
enabled: false
},
legend: {
enabled: false
},
global: {
useUTC: false
},
chart: {
type: 'bar'
},
title: {
text: ' '
},
subtitle: {
text: ''
},
xAxis:[{
categories: ['1', '2', '3', '4', '5','6', '7', '8', '9', '10'],
title: {
text: null
},
labels: {
rotation: -45
}
}],
yAxis:[{
min: 0,
labels:{
overflow: 'justify'
},
title: {
text: '单位 (kwh)',
align: 'high'
}
}],
tooltip: {
formatter: function(){
return this.x+':'+this.y+'kwh';
}
},
credits: {
enabled: false
},
plotOptions: {
bar: {
dataLabels: {
enabled: true
}
},
series: [{
type: 'bar'
}]
}
}
}
},
methods: {
picked(year, month, date) {
if(month < 10){
this.freezeMon = `${year}-0${month}`;
}else{
this.freezeMon = `${year}-${month}`;
}
this.getList();
},
routerBack(){
this.$router.go(-1);
},
getList(){
let maxLineCharts = this.$refs.maxLineCharts;
let minLineCharts = this.$refs.minLineCharts;
if(maxLineCharts != null && minLineCharts != null){
//移除所有Series
maxLineCharts.removeSeries();
minLineCharts.removeSeries();
//设置标题名
maxLineCharts.getChart().title.update({ text: '用能最大TOP10' });
minLineCharts.getChart().title.update({ text: '用能最小TOP10' });
var userType = sessionStorage.getItem('userType');
var areaCode = sessionStorage.getItem('areaCode');
this.$http.post(this.URLINFO + '/mobile/rankingMonitor/getDayFreezeApp.do',{yearMonth:this.freezeMon,userType:userType,areaCode:areaCode})
.then(function (res) {
var seriesData = []
var categoriesData = []
for(var i = 0;i < res.data.max.length; i++) {
//maxLineCharts.addSeries({name:res.data.max[i][1],data: [{name: res.data.max[i][1],y:res.data.max[i][2]}]});
seriesData.push([res.data.max[i][1],res.data.max[i][2]]);
categoriesData.push(res.data.max[i][1]);
}
maxLineCharts.addSeries({name: '用能',data: seriesData});
maxLineCharts.getChart().xAxis[0].setCategories(categoriesData);
seriesData = []
categoriesData = []
for(var i = 0;i < res.data.min.length; i++) {
//minLineCharts.addSeries({name:res.data.min[i][1],data: [{name: res.data.min[i][1],y:res.data.min[i][2]}]});
seriesData.push([res.data.min[i][1],res.data.min[i][2]]);
categoriesData.push(res.data.min[i][1]);
}
minLineCharts.addSeries({name: '用能',data: seriesData});
minLineCharts.getChart().xAxis[0].setCategories(categoriesData);
})
.catch(function (error) {
this.$toast('查询排名信息异常');
});
}
}
},
components: {
datepicker,
VueHighcharts
},
mounted () {
this.getList()
}
}
</script>
<style>
*{margin:0;padding:0; list-style:none }
h1,h2,h3,h4,h5,h6{font-size:16px; font-weight:normal;}
.rank-head{
width: 100%;
height: 40px;
position:fixed;
background: -webkit-linear-gradient(top,rgba(0,0,0,.6),rgba(0,0,0,0));
z-index: 999;
color: #fff;
font-size: 16px;
text-align: center;
line-height: 40px;
}
.container{
width: 100%;
overflow: hidden
}
.rank-head-back{
display: block;
float: left;
width: 40px;
height: 40px;
background: url("../assets/index/back.png") no-repeat center center;
background-size: 100% 100%;
}
</style>
Ce qui précède est ce que j'ai compilé pour vous. J'espère que cela vous sera utile à l'avenir.
Articles connexes :
Demande de données d'abord, puis rendu du partage dom dans vue
Solution au problème de la page Vue L'opération DOM ne prend pas effet Question
Nodejs implémente une méthode super simple de génération de code QR
Ce qui précède est le contenu détaillé de. pour plus d'informations, suivez d'autres articles connexes sur le site Web de PHP en chinois!

Outils d'IA chauds

Undresser.AI Undress
Application basée sur l'IA pour créer des photos de nu réalistes

AI Clothes Remover
Outil d'IA en ligne pour supprimer les vêtements des photos.

Undress AI Tool
Images de déshabillage gratuites

Clothoff.io
Dissolvant de vêtements AI

AI Hentai Generator
Générez AI Hentai gratuitement.

Article chaud

Outils chauds

Bloc-notes++7.3.1
Éditeur de code facile à utiliser et gratuit

SublimeText3 version chinoise
Version chinoise, très simple à utiliser

Envoyer Studio 13.0.1
Puissant environnement de développement intégré PHP

Dreamweaver CS6
Outils de développement Web visuel

SublimeText3 version Mac
Logiciel d'édition de code au niveau de Dieu (SublimeText3)
 La différence entre vivox100s et x100 : comparaison des performances et analyse des fonctions
Mar 23, 2024 pm 10:27 PM
Les téléphones mobiles vivox100 et x100 sont des modèles représentatifs de la gamme de produits de téléphonie mobile de Vivo. Ils représentent respectivement les niveaux de technologie haut de gamme de Vivo à différentes périodes. Par conséquent, ces deux téléphones mobiles présentent certaines différences en termes de conception, de performances et de fonctions. Cet article procédera à une comparaison détaillée entre ces deux téléphones mobiles en termes de comparaison des performances et d'analyse des fonctions pour aider les consommateurs à mieux choisir le téléphone mobile qui leur convient. Tout d’abord, examinons la comparaison des performances entre les vivox100 et x100. vivox100s est équipé des dernières
 Comment mettre en œuvre la double connexion WeChat sur les téléphones mobiles Huawei ?
Mar 24, 2024 am 11:27 AM
Comment mettre en œuvre la double connexion WeChat sur les téléphones mobiles Huawei ? Avec l’essor des réseaux sociaux, WeChat est devenu l’un des outils de communication indispensables dans la vie quotidienne des gens. Cependant, de nombreuses personnes peuvent rencontrer un problème : se connecter à plusieurs comptes WeChat en même temps sur le même téléphone mobile. Pour les utilisateurs de téléphones mobiles Huawei, il n'est pas difficile d'obtenir une double connexion WeChat. Cet article explique comment obtenir une double connexion WeChat sur les téléphones mobiles Huawei. Tout d'abord, le système EMUI fourni avec les téléphones mobiles Huawei offre une fonction très pratique : l'ouverture d'une double application. Grâce à la fonction de double ouverture de l'application, les utilisateurs peuvent simultanément
 Qu'est-ce que l'auto-média exactement ? Quelles sont ses principales caractéristiques et fonctions ?
Mar 21, 2024 pm 08:21 PM
Avec le développement rapide d'Internet, le concept d'auto-média est devenu profondément ancré dans le cœur des gens. Alors, qu’est-ce que l’auto-média exactement ? Quelles sont ses principales caractéristiques et fonctions ? Ensuite, nous explorerons ces questions une par une. 1. Qu’est-ce que l’auto-média exactement ? Nous-médias, comme son nom l’indique, signifie que vous êtes les médias. Il fait référence à un support d'informations grâce auquel des individus ou des équipes peuvent créer, éditer, publier et diffuser de manière indépendante du contenu via la plateforme Internet. Différent des médias traditionnels, tels que les journaux, la télévision, la radio, etc., les automédias sont plus interactifs et personnalisés, permettant à chacun de devenir producteur et diffuseur d'informations. 2. Quelles sont les principales caractéristiques et fonctions du self-média ? 1. Seuil bas : L’essor des médias autonomes a abaissé le seuil d’entrée dans l’industrie des médias. Des équipements encombrants et des équipes professionnelles ne sont plus nécessaires.
 Guide de programmation PHP : méthodes pour implémenter la séquence de Fibonacci
Mar 20, 2024 pm 04:54 PM
Le langage de programmation PHP est un outil puissant pour le développement Web, capable de prendre en charge une variété de logiques et d'algorithmes de programmation différents. Parmi eux, l’implémentation de la séquence de Fibonacci est un problème de programmation courant et classique. Dans cet article, nous présenterons comment utiliser le langage de programmation PHP pour implémenter la séquence de Fibonacci et joindrons des exemples de code spécifiques. La suite de Fibonacci est une suite mathématique définie comme suit : le premier et le deuxième élément de la suite valent 1, et à partir du troisième élément, la valeur de chaque élément est égale à la somme des deux éléments précédents. Les premiers éléments de la séquence
 Quelles sont les fonctions du logiciel de gestion de compte Xiaohongshu ? Comment gérer un compte Xiaohongshu ?
Mar 21, 2024 pm 04:16 PM
À mesure que Xiaohongshu devient populaire parmi les jeunes, de plus en plus de personnes commencent à utiliser cette plateforme pour partager divers aspects de leurs expériences et de leurs idées de vie. Comment gérer efficacement plusieurs comptes Xiaohongshu est devenu une question clé. Dans cet article, nous aborderons certaines des fonctionnalités du logiciel de gestion de compte Xiaohongshu et explorerons comment mieux gérer votre compte Xiaohongshu. À mesure que les médias sociaux se développent, de nombreuses personnes doivent gérer plusieurs comptes sociaux. C'est également un défi pour les utilisateurs de Xiaohongshu. Certains logiciels de gestion de compte Xiaohongshu peuvent aider les utilisateurs à gérer plusieurs comptes plus facilement, notamment la publication automatique de contenu, la publication programmée, l'analyse des données et d'autres fonctions. Grâce à ces outils, les utilisateurs peuvent gérer leurs comptes plus efficacement et accroître l'exposition et l'attention de leur compte. De plus, le logiciel de gestion de compte Xiaohongshu a
 Comment implémenter la fonction de clonage WeChat sur les téléphones mobiles Huawei
Mar 24, 2024 pm 06:03 PM
Comment mettre en œuvre la fonction de clonage WeChat sur les téléphones mobiles Huawei Avec la popularité des logiciels sociaux et l'importance croissante accordée à la confidentialité et à la sécurité, la fonction de clonage WeChat est progressivement devenue le centre d'attention. La fonction de clonage WeChat peut aider les utilisateurs à se connecter simultanément à plusieurs comptes WeChat sur le même téléphone mobile, ce qui facilite la gestion et l'utilisation. Il n'est pas difficile de mettre en œuvre la fonction de clonage WeChat sur les téléphones mobiles Huawei. Il vous suffit de suivre les étapes suivantes. Étape 1 : Assurez-vous que la version du système de téléphonie mobile et la version de WeChat répondent aux exigences. Tout d'abord, assurez-vous que la version de votre système de téléphonie mobile Huawei a été mise à jour vers la dernière version, ainsi que l'application WeChat.
 Astuces PHP : implémentez rapidement la fonction de retour à la page précédente
Mar 09, 2024 am 08:21 AM
Astuces PHP : Implémentez rapidement la fonction de retour à la page précédente. Dans le développement web, nous rencontrons souvent le besoin d'implémenter la fonction de retour à la page précédente. De telles opérations peuvent améliorer l’expérience utilisateur et faciliter la navigation des utilisateurs entre les pages Web. En PHP, nous pouvons réaliser cette fonction grâce à un code simple. Cet article présentera comment implémenter rapidement la fonction de retour à la page précédente et fournira des exemples de code PHP spécifiques. En PHP, on peut utiliser $_SERVER['HTTP_REFERER'] pour récupérer l'URL de la page précédente
 Découvrez comment Golang offre des possibilités de développement de jeux
Mar 16, 2024 pm 12:57 PM
Dans le domaine actuel du développement logiciel, Golang (langage Go), en tant que langage de programmation efficace, concis et hautement simultané, est de plus en plus favorisé par les développeurs. Sa riche bibliothèque de normes et ses fonctionnalités de concurrence efficaces en font un choix de premier plan dans le domaine du développement de jeux. Cet article explorera comment utiliser Golang pour le développement de jeux et démontrera ses puissantes possibilités à travers des exemples de code spécifiques. 1. Avantages de Golang dans le développement de jeux. En tant que langage typé statiquement, Golang est utilisé dans la construction de systèmes de jeux à grande échelle.


