 développement back-end
 Tutoriel Python
 Une collection d'exemples de méthodes de binarisation pour le traitement d'images Python
Une collection d'exemples de méthodes de binarisation pour le traitement d'images Python

Lors de l'utilisation de Python pour le traitement d'images, la binarisation est une étape très importante. J'ai maintenant résumé 6 méthodes de binarisation d'images que j'ai rencontrées (bien sûr, ce n'est certainement pas le cas. Toutes les méthodes de binarisation continueront. à ajouter si de nouvelles méthodes sont découvertes).
Recommandations d'apprentissage associées : Tutoriel vidéo Python
1. Seuil simple opencv cv2.threshold
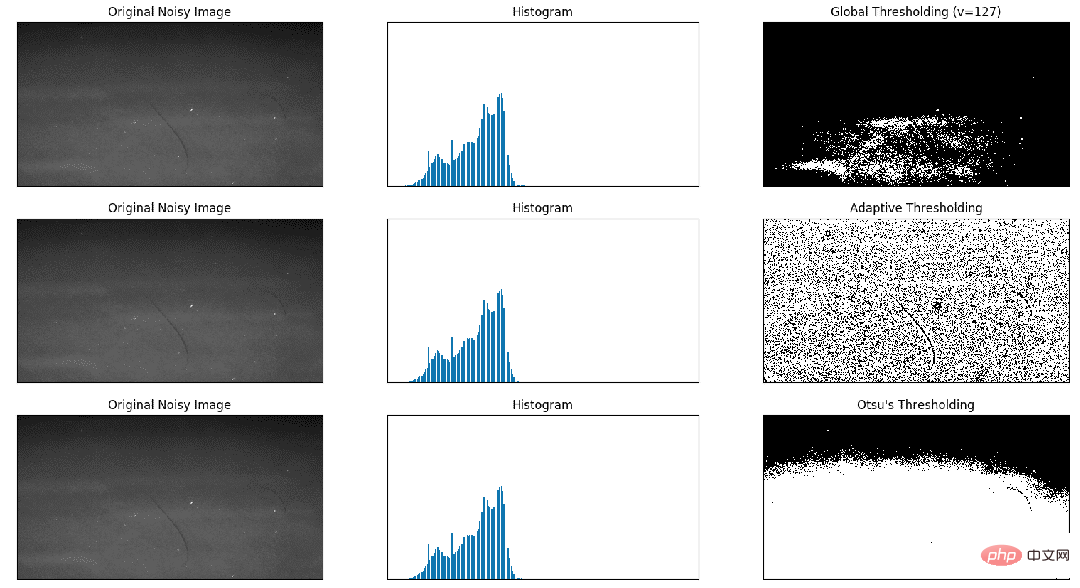
2. cv2.adaptiveThreshold (Il existe deux méthodes pour calculer les seuils dans les seuils adaptatifs : mean_c et guassian_c. Vous pouvez essayer laquelle est la meilleure)
3. Binarisation d'Otsu
Exemple :
import cv2
import numpy as np
from matplotlib import pyplot as plt

img = cv2.imread('scratch.png', 0)
# global thresholding
ret1, th1 = cv2.threshold(img, 127, 255, cv2.THRESH_BINARY)
# Otsu's thresholding
th2 = cv2.adaptiveThreshold(img, 255, cv2.ADAPTIVE_THRESH_MEAN_C, cv2.THRESH_BINARY, 11, 2)
# Otsu's thresholding
# 阈值一定要设为 0 !
ret3, th3 = cv2.threshold(img, 0, 255, cv2.THRESH_BINARY + cv2.THRESH_OTSU)
# plot all the images and their histograms
images = [img, 0, th1, img, 0, th2, img, 0, th3]
titles = [
  'Original Noisy Image', 'Histogram', 'Global Thresholding (v=127)',
  'Original Noisy Image', 'Histogram', "Adaptive Thresholding",
  'Original Noisy Image', 'Histogram', "Otsu's Thresholding"
]
# 这里使用了 pyplot 中画直方图的方法, plt.hist, 要注意的是它的参数是一维数组
# 所以这里使用了( numpy ) ravel 方法,将多维数组转换成一维,也可以使用 flatten 方法
# ndarray.flat 1-D iterator over an array.
# ndarray.flatten 1-D array copy of the elements of an array in row-major order.
for i in range(3):
  plt.subplot(3, 3, i * 3 + 1), plt.imshow(images[i * 3], 'gray')
  plt.title(titles[i * 3]), plt.xticks([]), plt.yticks([])
  plt.subplot(3, 3, i * 3 + 2), plt.hist(images[i * 3].ravel(), 256)
  plt.title(titles[i * 3 + 1]), plt.xticks([]), plt.yticks([])
  plt.subplot(3, 3, i * 3 + 3), plt.imshow(images[i * 3 + 2], 'gray')
  plt.title(titles[i * 3 + 2]), plt.xticks([]), plt.yticks([])
plt.show()

import matplotlib
import matplotlib.pyplot as plt

from skimage.data import page
from skimage.filters import (threshold_otsu, threshold_niblack,
               threshold_sauvola)


matplotlib.rcParams['font.size'] = 9


image = page()
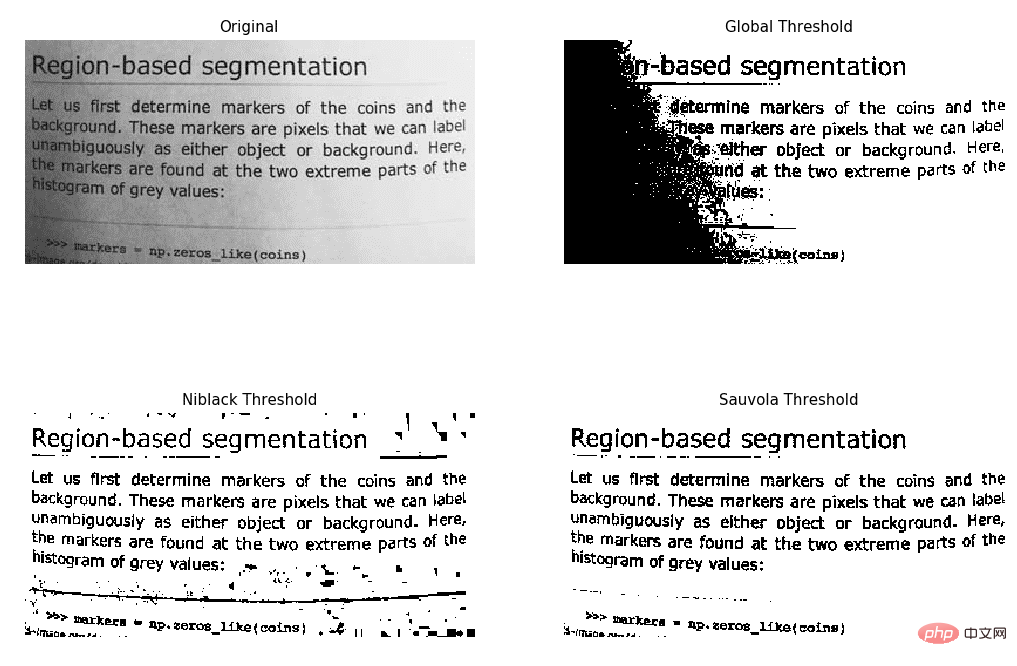
binary_global = image > threshold_otsu(image)

window_size = 25
thresh_niblack = threshold_niblack(image, window_size=window_size, k=0.8)
thresh_sauvola = threshold_sauvola(image, window_size=window_size)

binary_niblack = image > thresh_niblack
binary_sauvola = image > thresh_sauvola

plt.figure(figsize=(8, 7))
plt.subplot(2, 2, 1)
plt.imshow(image, cmap=plt.cm.gray)
plt.title('Original')
plt.axis('off')

plt.subplot(2, 2, 2)
plt.title('Global Threshold')
plt.imshow(binary_global, cmap=plt.cm.gray)
plt.axis('off')

plt.subplot(2, 2, 3)
plt.imshow(binary_niblack, cmap=plt.cm.gray)
plt.title('Niblack Threshold')
plt.axis('off')

plt.subplot(2, 2, 4)
plt.imshow(binary_sauvola, cmap=plt.cm.gray)
plt.title('Sauvola Threshold')
plt.axis('off')

plt.show()

Ce qui précède est le contenu détaillé de. pour plus d'informations, suivez d'autres articles connexes sur le site Web de PHP en chinois!

Outils d'IA chauds

Undresser.AI Undress
Application basée sur l'IA pour créer des photos de nu réalistes

AI Clothes Remover
Outil d'IA en ligne pour supprimer les vêtements des photos.

Undress AI Tool
Images de déshabillage gratuites

Clothoff.io
Dissolvant de vêtements AI

AI Hentai Generator
Générez AI Hentai gratuitement.

Article chaud

Outils chauds

Bloc-notes++7.3.1
Éditeur de code facile à utiliser et gratuit

SublimeText3 version chinoise
Version chinoise, très simple à utiliser

Envoyer Studio 13.0.1
Puissant environnement de développement intégré PHP

Dreamweaver CS6
Outils de développement Web visuel

SublimeText3 version Mac
Logiciel d'édition de code au niveau de Dieu (SublimeText3)
 PHP et Python: exemples de code et comparaison
Apr 15, 2025 am 12:07 AM
PHP et Python ont leurs propres avantages et inconvénients, et le choix dépend des besoins du projet et des préférences personnelles. 1.Php convient au développement rapide et à la maintenance des applications Web à grande échelle. 2. Python domine le domaine de la science des données et de l'apprentissage automatique.
 Python vs JavaScript: communauté, bibliothèques et ressources
Apr 15, 2025 am 12:16 AM
Python et JavaScript ont leurs propres avantages et inconvénients en termes de communauté, de bibliothèques et de ressources. 1) La communauté Python est amicale et adaptée aux débutants, mais les ressources de développement frontal ne sont pas aussi riches que JavaScript. 2) Python est puissant dans les bibliothèques de science des données et d'apprentissage automatique, tandis que JavaScript est meilleur dans les bibliothèques et les cadres de développement frontaux. 3) Les deux ont des ressources d'apprentissage riches, mais Python convient pour commencer par des documents officiels, tandis que JavaScript est meilleur avec MDNWEBDOCS. Le choix doit être basé sur les besoins du projet et les intérêts personnels.
 Explication détaillée du principe docker
Apr 14, 2025 pm 11:57 PM
Docker utilise les fonctionnalités du noyau Linux pour fournir un environnement de fonctionnement d'application efficace et isolé. Son principe de travail est le suivant: 1. Le miroir est utilisé comme modèle en lecture seule, qui contient tout ce dont vous avez besoin pour exécuter l'application; 2. Le Système de fichiers Union (UnionFS) empile plusieurs systèmes de fichiers, ne stockant que les différences, l'économie d'espace et l'accélération; 3. Le démon gère les miroirs et les conteneurs, et le client les utilise pour l'interaction; 4. Les espaces de noms et les CGROUP implémentent l'isolement des conteneurs et les limitations de ressources; 5. Modes de réseau multiples prennent en charge l'interconnexion du conteneur. Ce n'est qu'en comprenant ces concepts principaux que vous pouvez mieux utiliser Docker.
 Le code Visual Studio peut-il être utilisé dans Python
Apr 15, 2025 pm 08:18 PM
VS Code peut être utilisé pour écrire Python et fournit de nombreuses fonctionnalités qui en font un outil idéal pour développer des applications Python. Il permet aux utilisateurs de: installer des extensions Python pour obtenir des fonctions telles que la réalisation du code, la mise en évidence de la syntaxe et le débogage. Utilisez le débogueur pour suivre le code étape par étape, trouver et corriger les erreurs. Intégrez Git pour le contrôle de version. Utilisez des outils de mise en forme de code pour maintenir la cohérence du code. Utilisez l'outil de liaison pour repérer les problèmes potentiels à l'avance.
 Comment exécuter des programmes dans Terminal Vscode
Apr 15, 2025 pm 06:42 PM
Dans VS Code, vous pouvez exécuter le programme dans le terminal via les étapes suivantes: Préparez le code et ouvrez le terminal intégré pour vous assurer que le répertoire de code est cohérent avec le répertoire de travail du terminal. Sélectionnez la commande Run en fonction du langage de programmation (tel que Python de Python your_file_name.py) pour vérifier s'il s'exécute avec succès et résoudre les erreurs. Utilisez le débogueur pour améliorer l'efficacité du débogage.
 L'extension VScode est-elle malveillante?
Apr 15, 2025 pm 07:57 PM
Les extensions de code vs posent des risques malveillants, tels que la cachette de code malveillant, l'exploitation des vulnérabilités et la masturbation comme des extensions légitimes. Les méthodes pour identifier les extensions malveillantes comprennent: la vérification des éditeurs, la lecture des commentaires, la vérification du code et l'installation avec prudence. Les mesures de sécurité comprennent également: la sensibilisation à la sécurité, les bonnes habitudes, les mises à jour régulières et les logiciels antivirus.
 Python: automatisation, script et gestion des tâches
Apr 16, 2025 am 12:14 AM
Python excelle dans l'automatisation, les scripts et la gestion des tâches. 1) Automatisation: La sauvegarde du fichier est réalisée via des bibliothèques standard telles que le système d'exploitation et la fermeture. 2) Écriture de script: utilisez la bibliothèque PSUTIL pour surveiller les ressources système. 3) Gestion des tâches: utilisez la bibliothèque de planification pour planifier les tâches. La facilité d'utilisation de Python et la prise en charge de la bibliothèque riche en font l'outil préféré dans ces domaines.
 Peut-on exécuter le code sous Windows 8
Apr 15, 2025 pm 07:24 PM
VS Code peut fonctionner sur Windows 8, mais l'expérience peut ne pas être excellente. Assurez-vous d'abord que le système a été mis à jour sur le dernier correctif, puis téléchargez le package d'installation VS Code qui correspond à l'architecture du système et l'installez comme invité. Après l'installation, sachez que certaines extensions peuvent être incompatibles avec Windows 8 et doivent rechercher des extensions alternatives ou utiliser de nouveaux systèmes Windows dans une machine virtuelle. Installez les extensions nécessaires pour vérifier si elles fonctionnent correctement. Bien que le code VS soit possible sur Windows 8, il est recommandé de passer à un système Windows plus récent pour une meilleure expérience de développement et une meilleure sécurité.


