 développement back-end
 Tutoriel Python
 Comment implémenter le dessin d'un diagramme de Gantt en Python ?
Comment implémenter le dessin d'un diagramme de Gantt en Python ?
Preparation
Parce que nous devons utiliser les modules streamlit, streamlit-aggrid et plotly cette fois , téléchargez d'abord ces modules via la commande pip, où streamlit-aggrid est principalement utilisé pour présenter le tableau de données sur la pagestreamlit、streamlit-aggrid以及plotly模块,先通过pip命令将这些模块下载下来,其中streamlit-aggrid主要是将数据表能够呈现在页面上
pip install streamlit-aggrid
pip install plotly
页面的结构
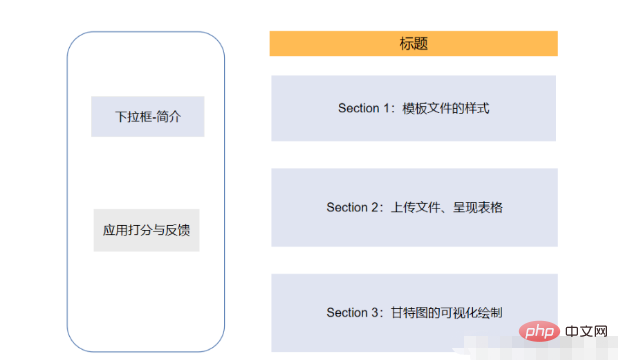
整体页面的结构是左边有一个工具栏,包含了该网页的一些简短介绍、以及一个希望使用者评分和反馈的模块
而右边则的Section1是项目规划文件的模板样式,主要是在CSV文件当中写清楚任务的细节,包括任务名称、任务描述、开始与结束时间等等内容。Section2则是允许用户上传自己的CSV文件,修改CSV文件中项目的内容以及一个可视化的呈现,而Section3则是将上述的内容导出至HTML文件当中去
代码部分
下面便是该页面的代码部分
from st_aggrid import AgGrid
import streamlit as st
import pandas as pd
import numpy as np
import plotly.express as px
from  PIL import Image
import io
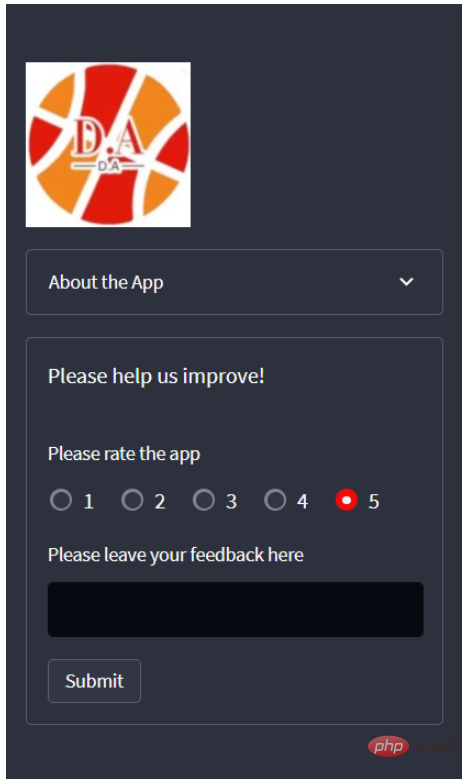
接下来我们针对左边工具栏的部分进行一个开发,主要是对该页面进行一个简单的介绍以及评分等功能
logo = Image.open(r'wechat_logo.jpg')
st.sidebar.image(logo, width=120)
with st.sidebar.expander("关于此APP的功能"):
st.write("""
项目的简单介绍)
""")
with st.sidebar.form(key='columns_in_form',clear_on_submit=True):
st.write('反馈')
st.write('<style>div.row-widget.stRadio > div{flex-direction:row;} </style>', unsafe_allow_html=True) # 水平方向的按钮
rating=st.radio("打分",('1','2','3','4','5'),index=4)
text=st.text_input(label='反馈')
submitted = st.form_submit_button('提交')
if submitted:
st.write('感谢')
st.markdown('您的评分是:')
st.markdown(rating)
st.markdown('您的反馈是:')
st.markdown(text)结果如下图所示

主页面的开发-Section 1
接下去便是主页面的Section 1部分的开发,主要是展示项目CSV文件的样式,包含了哪些列、列名分别是什么等等,代码如下
st.markdown(""" <style> .font {
font-size:30px ; font-family: 'Cooper Black'; color: #FF9633;}
</style> """, unsafe_allow_html=True)
st.markdown('<p class="font">上传您的CSV文件</p>', unsafe_allow_html=True)
st.subheader('第一步:下载模板文件')
image = Image.open(r'example.png') # 模板文件的截图
st.image(image, caption='确保列名是一致的')
@st.cache_data
def convert_df(df):
return df.to_csv().encode('utf-8')
df=pd.read_csv(r'template.csv', encoding='gbk')
csv = convert_df(df)
st.download_button(
label="下载模板",
data=csv,
file_name='project_template.csv',
mime='text/csv',
)我们提供了下载按钮可以让用户一键下载模板文件,最后呈现的样子是这样的

主页页面的开发-Section 2
接下去便是上传我们自己的CSV文件,这里我们用到了streamlit_aggrid模块,该模块的好处就在于可以对数据表进行一个展示,并且可以对其中的数据进行修改,
st.subheader('Step 2: Upload your project plan file')
uploaded_file = st.file_uploader(
    "上传文件",
    type=['csv'])
if uploaded_file is not None:
    Tasks = pd.read_csv(uploaded_file, encoding='gbk')
    Tasks['Start'] = Tasks['Start'].astype('datetime64')
    Tasks['Finish'] = Tasks['Finish'].astype('datetime64')

    grid_response = AgGrid(
        Tasks,
        editable=True,
        height=300,
        width='100%',
    )

    updated = grid_response['data']
df = pd.DataFrame(updated)output

接下去便是对数据的可视化呈现了,这里是用Plotly
st.subheader('第三部:绘制甘特图')

Options = st.selectbox("以下面哪种维度来绘制甘特图:", ['Team', 'Completion Pct'], index=0)
if st.button('绘制甘特图'):
    fig = px.timeline(
        df,
        x_start="Start",
        x_end="Finish",
        y="Task",
        color=Options,
        hover_name="Task Description"
    )

    fig.update_yaxes(
        autorange="reversed")

    fig.update_layout(
        title='Project Plan Gantt Chart',
        bargap=0.2,
        height=600,
        xaxis_title="Date",
        yaxis_title="Project Name",
        title_x=0.5,
        xaxis=dict(
            tickfont_size=15,
            tickangle=270,
            rangeslider_visible=True,
            side="top",
            showgrid=True,
            zeroline=True,
            showline=True,
            showticklabels=True,
            tickformat="%x\n",
        )
    )

    fig.update_xaxes(tickangle=0, tickfont=dict(family='Rockwell', color='blue', size=15))
    st.plotly_chart(fig, use_container_width=True)  # 绘制甘特图至页面上
    st.subheader(
        'Bonus: 导出至HTML')
    buffer = io.StringIO()
    fig.write_html(buffer, include_plotlyjs='cdn')
    html_bytes = buffer.getvalue().encode()
    st.download_button(
        label='Export to HTML',
        data=html_bytes,
        file_name='Gantt.html',
        mime='text/html'
    )
else:
st.write('---') #🎜🎜#
#🎜🎜#Développement de la page principale-Section 1
#🎜🎜#La prochaine étape est le développement de la section 1 de la page principale, principalement est le style d'affichage du fichier CSV du projet, quelles colonnes sont incluses, quels sont les noms des colonnes, etc. Le code est le suivant #🎜🎜#rrreee#🎜🎜# Nous fournissons un bouton de téléchargement qui permet aux utilisateurs de télécharger le fichier modèle en un clic, et à quoi ça ressemble au final C'est comme ça #🎜🎜##🎜🎜# #🎜🎜#
#🎜🎜#Développement de la page d'accueil - Section 2
#🎜🎜#La prochaine étape consiste à télécharger notre propre fichier CSV. Ici nous utilisons le modulestreamlit_aggrid. L'avantage de ce module est qu'il peut afficher le tableau de données et modifier les données qu'il contient, #🎜🎜#rrreee#🎜🎜#output#🎜🎜##🎜🎜. # #🎜🎜##🎜 🎜#La prochaine étape est la présentation visuelle des données. Bon, ici nous utilisons le module
 Plotly pour dessiner le diagramme de Gantt. Nous pouvons choisir de le dessiner du point de vue de l'équipe ou de l'avancement du projet. . Le code est le suivant #🎜🎜#rrreee.Ce qui précède est le contenu détaillé de. pour plus d'informations, suivez d'autres articles connexes sur le site Web de PHP en chinois!

Outils d'IA chauds

Undresser.AI Undress
Application basée sur l'IA pour créer des photos de nu réalistes

AI Clothes Remover
Outil d'IA en ligne pour supprimer les vêtements des photos.

Undress AI Tool
Images de déshabillage gratuites

Clothoff.io
Dissolvant de vêtements AI

AI Hentai Generator
Générez AI Hentai gratuitement.

Article chaud

Outils chauds

Bloc-notes++7.3.1
Éditeur de code facile à utiliser et gratuit

SublimeText3 version chinoise
Version chinoise, très simple à utiliser

Envoyer Studio 13.0.1
Puissant environnement de développement intégré PHP

Dreamweaver CS6
Outils de développement Web visuel

SublimeText3 version Mac
Logiciel d'édition de code au niveau de Dieu (SublimeText3)
 PHP et Python: exemples de code et comparaison
Apr 15, 2025 am 12:07 AM
PHP et Python ont leurs propres avantages et inconvénients, et le choix dépend des besoins du projet et des préférences personnelles. 1.Php convient au développement rapide et à la maintenance des applications Web à grande échelle. 2. Python domine le domaine de la science des données et de l'apprentissage automatique.
 Python vs JavaScript: communauté, bibliothèques et ressources
Apr 15, 2025 am 12:16 AM
Python et JavaScript ont leurs propres avantages et inconvénients en termes de communauté, de bibliothèques et de ressources. 1) La communauté Python est amicale et adaptée aux débutants, mais les ressources de développement frontal ne sont pas aussi riches que JavaScript. 2) Python est puissant dans les bibliothèques de science des données et d'apprentissage automatique, tandis que JavaScript est meilleur dans les bibliothèques et les cadres de développement frontaux. 3) Les deux ont des ressources d'apprentissage riches, mais Python convient pour commencer par des documents officiels, tandis que JavaScript est meilleur avec MDNWEBDOCS. Le choix doit être basé sur les besoins du projet et les intérêts personnels.
 Explication détaillée du principe docker
Apr 14, 2025 pm 11:57 PM
Docker utilise les fonctionnalités du noyau Linux pour fournir un environnement de fonctionnement d'application efficace et isolé. Son principe de travail est le suivant: 1. Le miroir est utilisé comme modèle en lecture seule, qui contient tout ce dont vous avez besoin pour exécuter l'application; 2. Le Système de fichiers Union (UnionFS) empile plusieurs systèmes de fichiers, ne stockant que les différences, l'économie d'espace et l'accélération; 3. Le démon gère les miroirs et les conteneurs, et le client les utilise pour l'interaction; 4. Les espaces de noms et les CGROUP implémentent l'isolement des conteneurs et les limitations de ressources; 5. Modes de réseau multiples prennent en charge l'interconnexion du conteneur. Ce n'est qu'en comprenant ces concepts principaux que vous pouvez mieux utiliser Docker.
 Le code Visual Studio peut-il être utilisé dans Python
Apr 15, 2025 pm 08:18 PM
VS Code peut être utilisé pour écrire Python et fournit de nombreuses fonctionnalités qui en font un outil idéal pour développer des applications Python. Il permet aux utilisateurs de: installer des extensions Python pour obtenir des fonctions telles que la réalisation du code, la mise en évidence de la syntaxe et le débogage. Utilisez le débogueur pour suivre le code étape par étape, trouver et corriger les erreurs. Intégrez Git pour le contrôle de version. Utilisez des outils de mise en forme de code pour maintenir la cohérence du code. Utilisez l'outil de liaison pour repérer les problèmes potentiels à l'avance.
 Comment exécuter des programmes dans Terminal Vscode
Apr 15, 2025 pm 06:42 PM
Dans VS Code, vous pouvez exécuter le programme dans le terminal via les étapes suivantes: Préparez le code et ouvrez le terminal intégré pour vous assurer que le répertoire de code est cohérent avec le répertoire de travail du terminal. Sélectionnez la commande Run en fonction du langage de programmation (tel que Python de Python your_file_name.py) pour vérifier s'il s'exécute avec succès et résoudre les erreurs. Utilisez le débogueur pour améliorer l'efficacité du débogage.
 L'extension VScode est-elle malveillante?
Apr 15, 2025 pm 07:57 PM
Les extensions de code vs posent des risques malveillants, tels que la cachette de code malveillant, l'exploitation des vulnérabilités et la masturbation comme des extensions légitimes. Les méthodes pour identifier les extensions malveillantes comprennent: la vérification des éditeurs, la lecture des commentaires, la vérification du code et l'installation avec prudence. Les mesures de sécurité comprennent également: la sensibilisation à la sécurité, les bonnes habitudes, les mises à jour régulières et les logiciels antivirus.
 Python: automatisation, script et gestion des tâches
Apr 16, 2025 am 12:14 AM
Python excelle dans l'automatisation, les scripts et la gestion des tâches. 1) Automatisation: La sauvegarde du fichier est réalisée via des bibliothèques standard telles que le système d'exploitation et la fermeture. 2) Écriture de script: utilisez la bibliothèque PSUTIL pour surveiller les ressources système. 3) Gestion des tâches: utilisez la bibliothèque de planification pour planifier les tâches. La facilité d'utilisation de Python et la prise en charge de la bibliothèque riche en font l'outil préféré dans ces domaines.
 Peut-on exécuter le code sous Windows 8
Apr 15, 2025 pm 07:24 PM
VS Code peut fonctionner sur Windows 8, mais l'expérience peut ne pas être excellente. Assurez-vous d'abord que le système a été mis à jour sur le dernier correctif, puis téléchargez le package d'installation VS Code qui correspond à l'architecture du système et l'installez comme invité. Après l'installation, sachez que certaines extensions peuvent être incompatibles avec Windows 8 et doivent rechercher des extensions alternatives ou utiliser de nouveaux systèmes Windows dans une machine virtuelle. Installez les extensions nécessaires pour vérifier si elles fonctionnent correctement. Bien que le code VS soit possible sur Windows 8, il est recommandé de passer à un système Windows plus récent pour une meilleure expérience de développement et une meilleure sécurité.


