 développement back-end
 Tutoriel Python
 Utilisez Python pour dessiner des animations GIF sympas qui surprennent tout le monde
Utilisez Python pour dessiner des animations GIF sympas qui surprennent tout le monde
Dans un article précédent, l'éditeur a expliqué comment utiliser gifModule à créergif模块来制作gif格式的图表,
厉害了,用Python绘制动态可视化图表,并保存成gif格式今天小编再给大家来介绍一种制作gif格式图表的新方法,调用的是matplotlib的相关模块,其中的步骤与方法也是相当地简单易懂。
下载和导入数据库
我们这次用到的数据集是bokeh模块自带的数据集,通过下面这一行代码直接就可以下载
import bokeh
bokeh.sampledata.download()
然后导入后面要用到的数据集,我们挑选的是指定国家的1950年至今不同年龄阶段的人口所占比重的数据
from bokeh.sampledata.population import data
import numpy as np

data = filter_loc('United States of America')
data.head()
output

先绘制若干张静态的图表
我们可以先绘制若干张静态的图表,然后将这几张图表合成一张gif格式的动图即可,代码如下
import seaborn as sns
import matplotlib.pyplot as plt
import matplotlib.patheffects as fx

# 绘制图表的函数
def make_plot(year):

    # 根据年份来筛选出数据
    df = data[data.Year == year]

    # 制作图表
    fig, (ax1, ax2) = plt.subplots(1, 2, sharey = True)
    ax1.invert_xaxis()
    fig.subplots_adjust(wspace = 0)

    ax1.barh(df[df.Sex == 'Male'].AgeGrp, df[df.Sex == 'Male'].percent, label = 'Male')
    ax2.barh(df[df.Sex == 'Female'].AgeGrp, df[df.Sex == 'Female'].percent, label = 'Female', color = 'C1')

    country = df.Location.iloc[0]
    if country == 'United States of America': country == 'US'

    fig.suptitle(f'......')
    fig.supxlabel('......')
    fig.legend(bbox_to_anchor = (0.9, 0.88), loc = 'upper right')
    ax1.set_ylabel('Age Groups')

    return fig
我们自定义了一个绘制图表的函数,其中的参数是年份,逻辑很简单,我们是想根据年份来筛选出数据,然后根据筛选出的数据来绘制图表,每一年的图表不尽相同
years = [i for i in set(data.Year) if i < 2022]
years.sort()

for year in years:
    fig = make_plot(year)
    fig.savefig(f'{year}.jpeg',bbox_inches = 'tight')
output
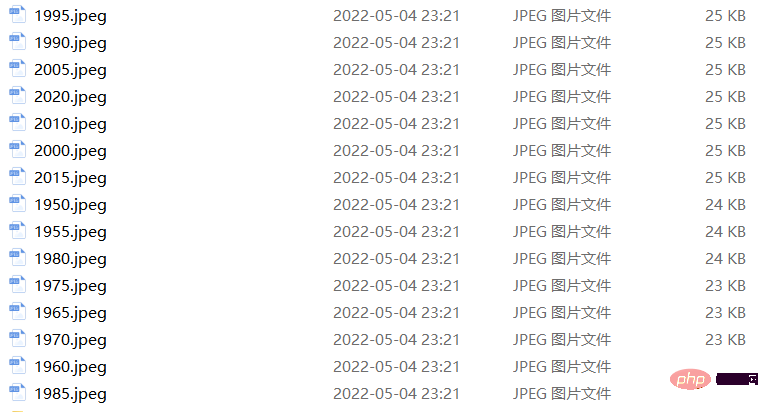
这样我们就生成了若干张静态的图表,然后集合成gif
matplotlibPertinent modules, les étapes et les méthodes sont également assez simples et faciles à comprendre. Téléchargez et importez la base de données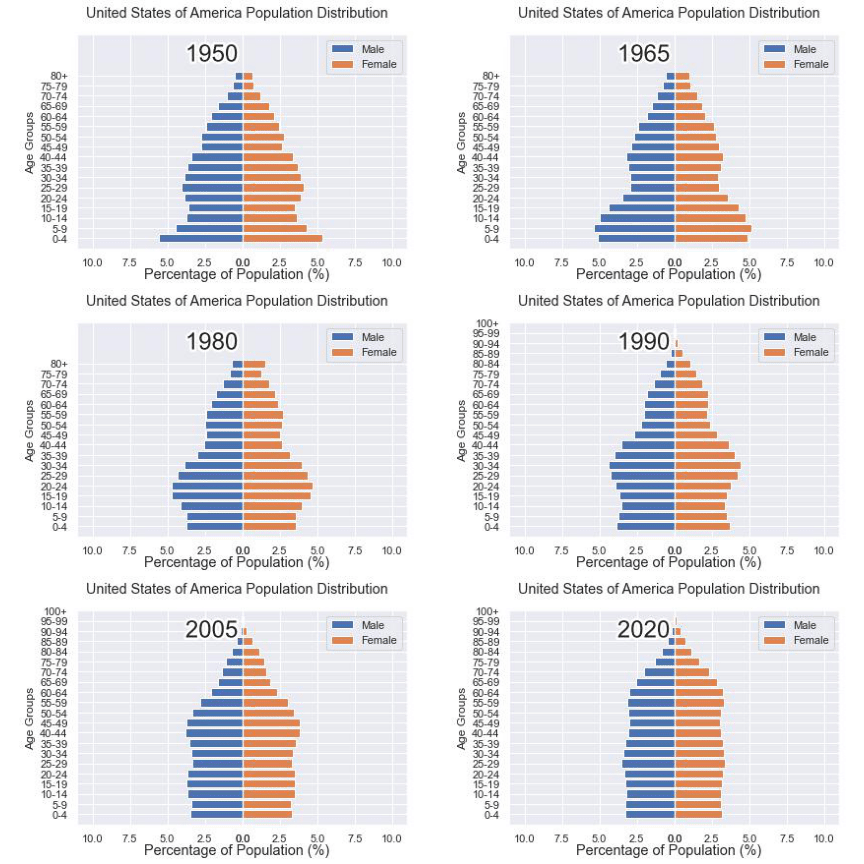
 L'ensemble de données que nous avons utilisé cette fois est
bokehL'ensemble de données fourni avec le module peut être téléchargé directement via la ligne de code suivante
import matplotlib.animation as animation
fig, ax = plt.subplots()
ims = []

for year in years:
    im = ax.imshow(plt.imread(f'{year}.jpeg'), animated = True)
    ims.append([im])

ani = animation.ArtistAnimation(fig, ims, interval=600)
ani.save('us_population.gif')
puis importé pour utilisation ultérieure L'ensemble de données que nous avons sélectionné correspond aux données sur la proportion de la population des différents groupes d'âge dans le pays spécifié de 1950 à nos jours fig, (ax1, ax2) = plt.subplots(1, 2, sharey = True)
df = data[data.Year == 1955]
y_pos = [i for i in range(len(df[df.Sex == 'Male']))]
male = ax1.barh(y_pos, df[df.Sex == 'Male'].percent, label = 'Male',
tick_label = df[df.Sex == 'Male'].AgeGrp)
female = ax2.barh(y_pos, df[df.Sex == 'Female'].percent, label = 'Female',
color = 'C1', tick_label = df[df.Sex == 'Male'].AgeGrp)
ax1.invert_xaxis()
fig.suptitle('.......')
fig.supxlabel('....... (%)')
fig.legend(bbox_to_anchor = (0.9, 0.88), loc = 'upper right')
ax1.set_ylabel('Age Groups')
Copier après la connexionoutput
fig, (ax1, ax2) = plt.subplots(1, 2, sharey = True)

df = data[data.Year == 1955]

y_pos = [i for i in range(len(df[df.Sex == 'Male']))]
male = ax1.barh(y_pos, df[df.Sex == 'Male'].percent, label = 'Male',
               tick_label = df[df.Sex == 'Male'].AgeGrp)
female = ax2.barh(y_pos, df[df.Sex == 'Female'].percent, label = 'Female',
                  color = 'C1', tick_label = df[df.Sex == 'Male'].AgeGrp)

ax1.invert_xaxis()
fig.suptitle('.......')
fig.supxlabel('....... (%)')
fig.legend(bbox_to_anchor = (0.9, 0.88), loc = 'upper right')
ax1.set_ylabel('Age Groups')
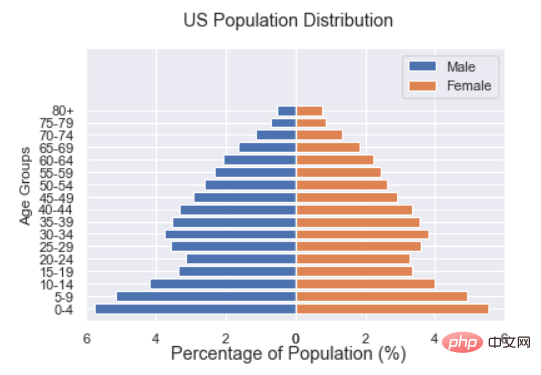
Nous pouvons d'abord dessiner plusieurs graphiques statiques, puis combiner ces graphiques en un seulgif une animation au format suffit, le code est le suivant
def run(year):
    # 通过年份来筛选出数据
    df = data[data.Year == year]
    # 针对不同地性别来绘制
    total_pop = df.Value.sum()
    df['percent'] = df.Value / total_pop * 100
    male.remove()
    y_pos = [i for i in range(len(df[df.Sex == 'Male']))]
    male.patches = ax1.barh(y_pos, df[df.Sex == 'Male'].percent, label = 'Male',
                     color = 'C0', tick_label = df[df.Sex == 'Male'].AgeGrp)
    female.remove()
    female.patches = ax2.barh(y_pos, df[df.Sex == 'Female'].percent, label = 'Female',

                 color = 'C1', tick_label = df[df.Sex == 'Female'].AgeGrp)

    text.set_text(year)
    return male#, female
ani = animation.FuncAnimation(fig, run, years, blit = True, repeat = True,
                              interval = 600)
ani.save('文件名.gif')
gif Plusieurs graphiques au format, Le code est le suivant. #🎜🎜##🎜🎜#Peut-être qu'après avoir vu cela, certaines personnes pourraient penser que la méthode mentionnée ci-dessus est un peu gênante. Après tout, nous devons d'abord générer des dizaines de graphiques statiques. Si l'espace disque de l'ordinateur est un peu restreint, ou ce n'est pas encore comme ça. Un endroit pour stocker ces dizaines de graphiques. Vous vous demanderez donc si cela peut se faire en une seule étape. Bien sûr, c’est possible. Par exemple, si nous envisageons de tracer la répartition des proportions de population à différents âges de 1950 à 2020, la première étape consiste à tracer la répartition des proportions de population à différents âges en 1950, qui est l’année de départ. Figure, le code est le suivant #🎜🎜#import matplotlib.animation as animation
# 创建一个新的画布
fig, (ax, ax2, ax3) = plt.subplots(1, 3, figsize = (10, 3))
ims = []
for year in years:
im = ax.imshow(plt.imread(f'文件1{year}.jpeg'), animated = True)
im2 = ax2.imshow(plt.imread(f'文件2{year}.jpeg'), animated = True)
im3 = ax3.imshow(plt.imread(f'文件3{year}.jpeg'), animated = True)
ims.append([im, im2, im3])
ani = animation.ArtistAnimation(fig, ims, interval=600)
ani.save('comparison.gif')
def run(year):
# 通过年份来筛选出数据
df = data[data.Year == year]
# 针对不同地性别来绘制
total_pop = df.Value.sum()
df['percent'] = df.Value / total_pop * 100
male.remove()
y_pos = [i for i in range(len(df[df.Sex == 'Male']))]
male.patches = ax1.barh(y_pos, df[df.Sex == 'Male'].percent, label = 'Male',
color = 'C0', tick_label = df[df.Sex == 'Male'].AgeGrp)
female.remove()
female.patches = ax2.barh(y_pos, df[df.Sex == 'Female'].percent, label = 'Female',
color = 'C1', tick_label = df[df.Sex == 'Female'].AgeGrp)
text.set_text(year)
return male#, female
然后我们调用animation.FuncAnimation()方法,
ani = animation.FuncAnimation(fig, run, years, blit = True, repeat = True,
interval = 600)
ani.save('文件名.gif')
output
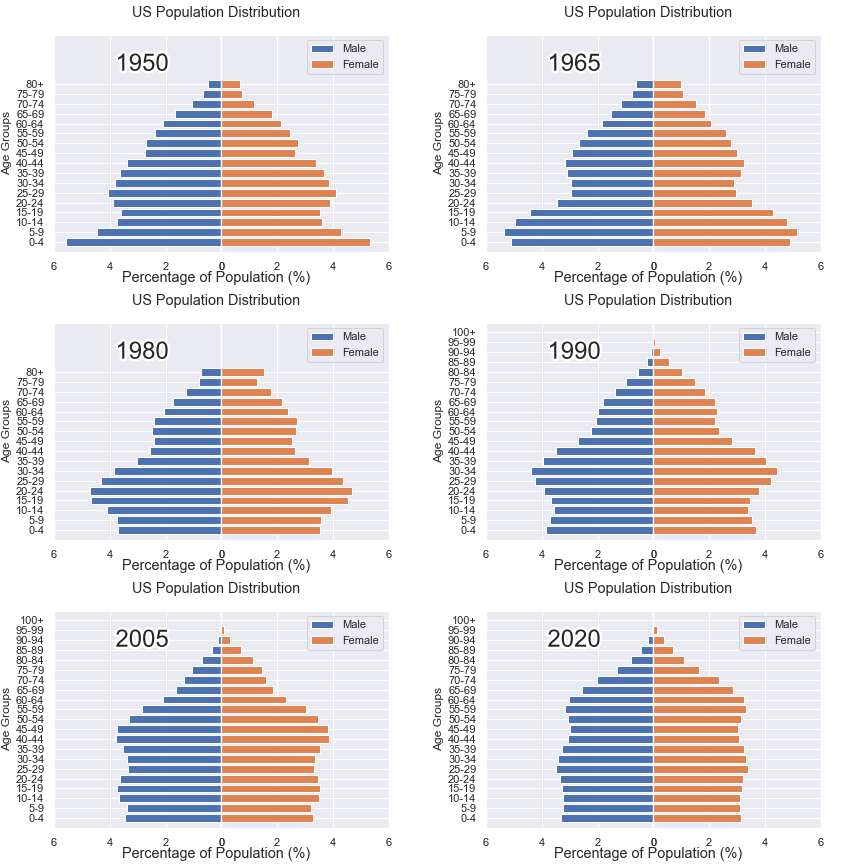
这样就可以一步到位生成gif格式的图表,避免生成数十张繁多地静态图片了。
将若干张<span style="color: #2b2b2b;">gif</span>动图放置在一张大图当中
最后我们可以将若干张gif动图放置在一张大的图表当中,代码如下
import matplotlib.animation as animation

# 创建一个新的画布
fig, (ax, ax2, ax3) = plt.subplots(1, 3, figsize = (10, 3))

ims = []
for year in years:
    im = ax.imshow(plt.imread(f'文件1{year}.jpeg'), animated = True)
    im2 = ax2.imshow(plt.imread(f'文件2{year}.jpeg'), animated = True)
    im3 = ax3.imshow(plt.imread(f'文件3{year}.jpeg'), animated = True)
    ims.append([im, im2, im3])

ani = animation.ArtistAnimation(fig, ims, interval=600)
ani.save('comparison.gif')
output

Ce qui précède est le contenu détaillé de. pour plus d'informations, suivez d'autres articles connexes sur le site Web de PHP en chinois!

Outils d'IA chauds

Undresser.AI Undress
Application basée sur l'IA pour créer des photos de nu réalistes

AI Clothes Remover
Outil d'IA en ligne pour supprimer les vêtements des photos.

Undress AI Tool
Images de déshabillage gratuites

Clothoff.io
Dissolvant de vêtements AI

Video Face Swap
Échangez les visages dans n'importe quelle vidéo sans effort grâce à notre outil d'échange de visage AI entièrement gratuit !

Article chaud

Outils chauds

Bloc-notes++7.3.1
Éditeur de code facile à utiliser et gratuit

SublimeText3 version chinoise
Version chinoise, très simple à utiliser

Envoyer Studio 13.0.1
Puissant environnement de développement intégré PHP

Dreamweaver CS6
Outils de développement Web visuel

SublimeText3 version Mac
Logiciel d'édition de code au niveau de Dieu (SublimeText3)

Sujets chauds
 1393
1393
 52
52
 1205
1205
 24
24
 PHP et Python: différents paradigmes expliqués
Apr 18, 2025 am 12:26 AM
PHP est principalement la programmation procédurale, mais prend également en charge la programmation orientée objet (POO); Python prend en charge une variété de paradigmes, y compris la POO, la programmation fonctionnelle et procédurale. PHP convient au développement Web, et Python convient à une variété d'applications telles que l'analyse des données et l'apprentissage automatique.
 Choisir entre PHP et Python: un guide
Apr 18, 2025 am 12:24 AM
PHP convient au développement Web et au prototypage rapide, et Python convient à la science des données et à l'apprentissage automatique. 1.Php est utilisé pour le développement Web dynamique, avec une syntaxe simple et adapté pour un développement rapide. 2. Python a une syntaxe concise, convient à plusieurs champs et a un écosystème de bibliothèque solide.
 Le code Visual Studio peut-il être utilisé dans Python
Apr 15, 2025 pm 08:18 PM
VS Code peut être utilisé pour écrire Python et fournit de nombreuses fonctionnalités qui en font un outil idéal pour développer des applications Python. Il permet aux utilisateurs de: installer des extensions Python pour obtenir des fonctions telles que la réalisation du code, la mise en évidence de la syntaxe et le débogage. Utilisez le débogueur pour suivre le code étape par étape, trouver et corriger les erreurs. Intégrez Git pour le contrôle de version. Utilisez des outils de mise en forme de code pour maintenir la cohérence du code. Utilisez l'outil de liaison pour repérer les problèmes potentiels à l'avance.
 Peut-on exécuter le code sous Windows 8
Apr 15, 2025 pm 07:24 PM
VS Code peut fonctionner sur Windows 8, mais l'expérience peut ne pas être excellente. Assurez-vous d'abord que le système a été mis à jour sur le dernier correctif, puis téléchargez le package d'installation VS Code qui correspond à l'architecture du système et l'installez comme invité. Après l'installation, sachez que certaines extensions peuvent être incompatibles avec Windows 8 et doivent rechercher des extensions alternatives ou utiliser de nouveaux systèmes Windows dans une machine virtuelle. Installez les extensions nécessaires pour vérifier si elles fonctionnent correctement. Bien que le code VS soit possible sur Windows 8, il est recommandé de passer à un système Windows plus récent pour une meilleure expérience de développement et une meilleure sécurité.
 Python vs JavaScript: la courbe d'apprentissage et la facilité d'utilisation
Apr 16, 2025 am 12:12 AM
Python convient plus aux débutants, avec une courbe d'apprentissage en douceur et une syntaxe concise; JavaScript convient au développement frontal, avec une courbe d'apprentissage abrupte et une syntaxe flexible. 1. La syntaxe Python est intuitive et adaptée à la science des données et au développement back-end. 2. JavaScript est flexible et largement utilisé dans la programmation frontale et côté serveur.
 L'extension VScode est-elle malveillante?
Apr 15, 2025 pm 07:57 PM
Les extensions de code vs posent des risques malveillants, tels que la cachette de code malveillant, l'exploitation des vulnérabilités et la masturbation comme des extensions légitimes. Les méthodes pour identifier les extensions malveillantes comprennent: la vérification des éditeurs, la lecture des commentaires, la vérification du code et l'installation avec prudence. Les mesures de sécurité comprennent également: la sensibilisation à la sécurité, les bonnes habitudes, les mises à jour régulières et les logiciels antivirus.
 PHP et Python: une plongée profonde dans leur histoire
Apr 18, 2025 am 12:25 AM
PHP est originaire en 1994 et a été développé par Rasmuslerdorf. Il a été utilisé à l'origine pour suivre les visiteurs du site Web et a progressivement évolué en un langage de script côté serveur et a été largement utilisé dans le développement Web. Python a été développé par Guidovan Rossum à la fin des années 1980 et a été publié pour la première fois en 1991. Il met l'accent sur la lisibilité et la simplicité du code, et convient à l'informatique scientifique, à l'analyse des données et à d'autres domaines.
 Comment exécuter des programmes dans Terminal Vscode
Apr 15, 2025 pm 06:42 PM
Dans VS Code, vous pouvez exécuter le programme dans le terminal via les étapes suivantes: Préparez le code et ouvrez le terminal intégré pour vous assurer que le répertoire de code est cohérent avec le répertoire de travail du terminal. Sélectionnez la commande Run en fonction du langage de programmation (tel que Python de Python your_file_name.py) pour vérifier s'il s'exécute avec succès et résoudre les erreurs. Utilisez le débogueur pour améliorer l'efficacité du débogage.


