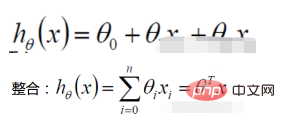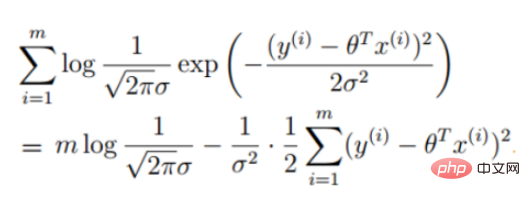

La définition de la fonction de vraisemblance : donner La fonction du paramètre (inconnu) sous une valeur d'échantillon conjointe donnée X
🎜#
Fonction de vraisemblance : Quel type de paramètres sont exactement les vraies valeurs lorsqu'elles sont combinées avec nos données ? 🎜🎜#

(l'expression de l'erreur, notre objectif est de minimiser l'erreur entre le vrai valeur et la valeur prédite) #🎜🎜 #
(La dérivée est 0 pour obtenir la valeur extrême et obtenir les paramètres de la fonction)#🎜 🎜#Régression logistique


Les données de prémisse obéissent à la distribution de Bernoulli
# 🎜🎜#
dans une tâche de descente de gradient, fonction objectif de régression logistique# 🎜🎜#
Solution de la méthode de descente de gradient  Ma compréhension est d'utiliser la dérivation pour mettre à jour les paramètres, s'arrêter après avoir atteint une certaine condition et obtenir la solution optimale approximative
def sigmoid(z):
   return 1 / (1 + np.exp(-z))
def model(X, theta):
return sigmoid(np.dot(X, theta.T))def cost(X, y, theta):
left = np.multiply(-y, np.log(model(X, theta)))
right = np.multiply(1 - y, np.log(1 - model(X, theta)))
return np.sum(left - right) / (len(X))
def gradient(X, y, theta):
grad = np.zeros(theta.shape)
error = (model(X, theta)- y).ravel()
for j in range(len(theta.ravel())): #for each parmeter
term = np.multiply(error, X[:,j])
grad[0, j] = np.sum(term) / len(X)
return gradSTOP_ITER = 0
STOP_COST = 1
STOP_GRAD = 2
def stopCriterion(type, value, threshold):
# 设定三种不同的停止策略
if type == STOP_ITER: # 设定迭代次数
return value > threshold
elif type == STOP_COST: # 根据损失值停止
return abs(value[-1] - value[-2]) < threshold
elif type == STOP_GRAD: # 根据梯度变化停止
return np.linalg.norm(value) < thresholdExemple de remaniement
import numpy.random
#洗牌
def shuffleData(data):
np.random.shuffle(data)
cols = data.shape[1]
X = data[:, 0:cols-1]
y = data[:, cols-1:]
return X, ydef descent(data, theta, batchSize, stopType, thresh, alpha):
# 梯度下降求解
init_time = time.time()
i = 0 # 迭代次数
k = 0 # batch
X, y = shuffleData(data)
grad = np.zeros(theta.shape) # 计算的梯度
costs = [cost(X, y, theta)] # 损失值
while True:
grad = gradient(X[k:k + batchSize], y[k:k + batchSize], theta)
k += batchSize # 取batch数量个数据
if k >= n:
k = 0
X, y = shuffleData(data) # 重新洗牌
theta = theta - alpha * grad # 参数更新
costs.append(cost(X, y, theta)) # 计算新的损失
i += 1
if stopType == STOP_ITER:
value = i
elif stopType == STOP_COST:
value = costs
elif stopType == STOP_GRAD:
value = grad
if stopCriterion(stopType, value, thresh): break
return theta, i - 1, costs, grad, time.time() - init_time Code complet# 🎜🎜#
import numpy as np
import pandas as pd
import matplotlib.pyplot as plt
import os
import numpy.random
import time
def sigmoid(z):
return 1 / (1 + np.exp(-z))
def model(X, theta):
return sigmoid(np.dot(X, theta.T))
def cost(X, y, theta):
     left = np.multiply(-y, np.log(model(X, theta)))
     right = np.multiply(1 - y, np.log(1 - model(X, theta)))
     return np.sum(left - right) / (len(X))
def gradient(X, y, theta):
grad = np.zeros(theta.shape)
error = (model(X, theta) - y).ravel()
for j in range(len(theta.ravel())): # for each parmeter
term = np.multiply(error, X[:, j])
grad[0, j] = np.sum(term) / len(X)
return grad
STOP_ITER = 0
STOP_COST = 1
STOP_GRAD = 2

def stopCriterion(type, value, threshold):
    # 设定三种不同的停止策略
    if type == STOP_ITER:  # 设定迭代次数
        return value > threshold
    elif type == STOP_COST:  # 根据损失值停止
        return abs(value[-1] - value[-2]) < threshold
    elif type == STOP_GRAD:  # 根据梯度变化停止
        return np.linalg.norm(value) < threshold
# 洗牌
def shuffleData(data):
np.random.shuffle(data)
cols = data.shape[1]
X = data[:, 0:cols - 1]
y = data[:, cols - 1:]
return X, y
def descent(data, theta, batchSize, stopType, thresh, alpha):
    # 梯度下降求解

    init_time = time.time()
    i = 0  # 迭代次数
    k = 0  # batch
    X, y = shuffleData(data)
    grad = np.zeros(theta.shape)  # 计算的梯度
    costs = [cost(X, y, theta)]  # 损失值

    while True:
        grad = gradient(X[k:k + batchSize], y[k:k + batchSize], theta)
        k += batchSize  # 取batch数量个数据
        if k >= n:
            k = 0
            X, y = shuffleData(data)  # 重新洗牌
        theta = theta - alpha * grad  # 参数更新
        costs.append(cost(X, y, theta))  # 计算新的损失
        i += 1

        if stopType == STOP_ITER:
            value = i
        elif stopType == STOP_COST:
            value = costs
        elif stopType == STOP_GRAD:
            value = grad
        if stopCriterion(stopType, value, thresh): break

    return theta, i - 1, costs, grad, time.time() - init_time
def runExpe(data, theta, batchSize, stopType, thresh, alpha):
# import pdb
# pdb.set_trace()
theta, iter, costs, grad, dur = descent(data, theta, batchSize, stopType, thresh, alpha)
name = "Original" if (data[:, 1] > 2).sum() > 1 else "Scaled"
name += " data - learning rate: {} - ".format(alpha)
if batchSize == n:
strDescType = "Gradient" # 批量梯度下降
elif batchSize == 1:
strDescType = "Stochastic" # 随机梯度下降
else:
strDescType = "Mini-batch ({})".format(batchSize) # 小批量梯度下降
name += strDescType + " descent - Stop: "
if stopType == STOP_ITER:
strStop = "{} iterations".format(thresh)
elif stopType == STOP_COST:
strStop = "costs change < {}".format(thresh)
else:
strStop = "gradient norm < {}".format(thresh)
name += strStop
print("***{}\nTheta: {} - Iter: {} - Last cost: {:03.2f} - Duration: {:03.2f}s".format(
name, theta, iter, costs[-1], dur))
fig, ax = plt.subplots(figsize=(12, 4))
ax.plot(np.arange(len(costs)), costs, 'r')
ax.set_xlabel('Iterations')
ax.set_ylabel('Cost')
ax.set_title(name.upper() + ' - Error vs. Iteration')
return theta
path = 'data' + os.sep + 'LogiReg_data.txt'
pdData = pd.read_csv(path, header=None, names=['Exam 1', 'Exam 2', 'Admitted'])
positive = pdData[pdData['Admitted'] == 1]
negative = pdData[pdData['Admitted'] == 0]
# 画图观察样本情况
fig, ax = plt.subplots(figsize=(10, 5))
ax.scatter(positive['Exam 1'], positive['Exam 2'], s=30, c='b', marker='o', label='Admitted')
ax.scatter(negative['Exam 1'], negative['Exam 2'], s=30, c='r', marker='x', label='Not Admitted')
ax.legend()
ax.set_xlabel('Exam 1 Score')
ax.set_ylabel('Exam 2 Score')
pdData.insert(0, 'Ones', 1)
# 划分训练数据与标签
orig_data = pdData.values
cols = orig_data.shape[1]
X = orig_data[:, 0:cols - 1]
y = orig_data[:, cols - 1:cols]
# 设置初始参数0
theta = np.zeros([1, 3])
# 选择的梯度下降方法是基于所有样本的
n = 100
runExpe(orig_data, theta, n, STOP_ITER, thresh=5000, alpha=0.000001)
runExpe(orig_data, theta, n, STOP_COST, thresh=0.000001, alpha=0.001)
runExpe(orig_data, theta, n, STOP_GRAD, thresh=0.05, alpha=0.001)
runExpe(orig_data, theta, 1, STOP_ITER, thresh=5000, alpha=0.001)
runExpe(orig_data, theta, 1, STOP_ITER, thresh=15000, alpha=0.000002)
runExpe(orig_data, theta, 16, STOP_ITER, thresh=15000, alpha=0.001)
from sklearn import preprocessing as pp
# 数据预处理
scaled_data = orig_data.copy()
scaled_data[:, 1:3] = pp.scale(orig_data[:, 1:3])
runExpe(scaled_data, theta, n, STOP_ITER, thresh=5000, alpha=0.001)
runExpe(scaled_data, theta, n, STOP_GRAD, thresh=0.02, alpha=0.001)
theta = runExpe(scaled_data, theta, 1, STOP_GRAD, thresh=0.002 / 5, alpha=0.001)
runExpe(scaled_data, theta, 16, STOP_GRAD, thresh=0.002 * 2, alpha=0.001)
# 设定阈值
def predict(X, theta):
return [1 if x >= 0.5 else 0 for x in model(X, theta)]
# 计算精度
scaled_X = scaled_data[:, :3]
y = scaled_data[:, 3]
predictions = predict(scaled_X, theta)
correct = [1 if ((a == 1 and b == 1) or (a == 0 and b == 0)) else 0 for (a, b) in zip(predictions, y)]
accuracy = (sum(map(int, correct)) % len(correct))
print('accuracy = {0}%'.format(accuracy)) # 🎜🎜#
# 🎜🎜#

Cela demande peu de ressources, notamment de mémoire. Parce que seules les valeurs caractéristiques de chaque dimension doivent être stockées.
Ajustez facilement les résultats de sortie. La régression logistique peut facilement obtenir le résultat final de la classification, car le résultat est le score de probabilité de chaque échantillon, et nous pouvons facilement couper ces scores de probabilité, c'est-à-dire diviser le seuil (ceux supérieurs à un certain seuil sont classés dans une catégorie, et ceux inférieurs à un certain seuil sont classés dans une seule catégorie). 

La précision n'est pas très élevée. Le formulaire étant très simple (très similaire à un modèle linéaire), il est difficile d’adapter la véritable distribution des données.
Il est difficile de résoudre le problème du déséquilibre des données. Par exemple : si nous traitons d'un problème dans lequel les échantillons positifs et négatifs sont très déséquilibrés, par exemple le rapport des échantillons positifs et négatifs est de 10 000 : 1. Si nous prédisons que tous les échantillons sont positifs, nous pouvons également calculer la valeur de la fonction de perte. plus petit. Mais en tant que classificateur, sa capacité à distinguer les échantillons positifs et négatifs ne sera pas très bonne.
Le traitement des données non linéaires est plus gênant. La régression logistique, sans introduire d'autres méthodes, ne peut traiter que des données linéairement séparables, ou encore, gérer des problèmes de classification binaire.
La régression logistique elle-même ne peut pas filtrer les fonctionnalités. Parfois, nous utilisons gbdt pour filtrer les fonctionnalités, puis utilisons la régression logistique.
Ce qui précède est le contenu détaillé de. pour plus d'informations, suivez d'autres articles connexes sur le site Web de PHP en chinois!