

Comment surveiller Nginx/Tomcat/MySQL avec zabbix

zabbix监控nginx
a机器:zabbix服务端(192.168.234.128) b机器:zabbix客户端(192.168.234.125)
在b机器(zabbix客户端)操作:
编辑nginx虚拟主机配置文件:
[root@centos ~]# vi /etc/nginx/conf.d/default.conf
在server{}中添加以下内容:
 location /nginx_status
 {
  stub_status on;
  access_log off;
  allow 127.0.0.1;
  deny all;
}重载nginx配置:
[root@centos ~]# nginx -s reload
测试:
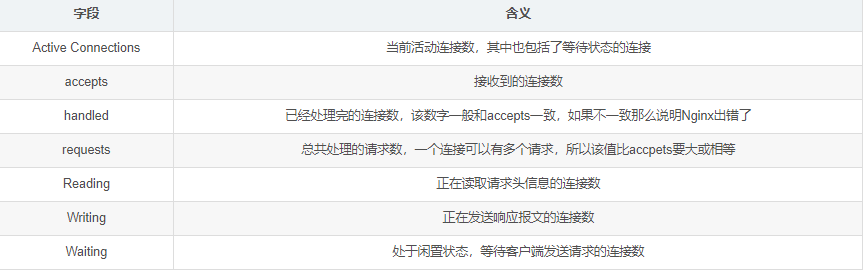
[root@centos ~]# curl http://127.0.0.1/nginx_status
active connections: 1
server accepts handled requests
 3 3 3
reading: 0 writing: 1 waiting: 0
#nginx状态信息已显示
状态说明:
添加监控脚本:
vi /usr/local/sbin/ngx_status.sh
添加以下内容:
#!/bin/bash
url="http://127.0.0.1/nginx_status"
curl=/usr/bin/curl

# 检测nginx进程是否存在
function ping {
 /sbin/pidof nginx | wc -l
}
# 检测nginx性能
function active {
 $curl $url 2>/dev/null| grep 'active' | awk '{print $nf}'
}
function reading {
 $curl $url 2>/dev/null| grep 'reading' | awk '{print $2}'
}
function writing {
 $curl $url 2>/dev/null| grep 'writing' | awk '{print $4}'
}
function waiting {
 $curl $url 2>/dev/null| grep 'waiting' | awk '{print $6}'
}
function accepts {
 $curl $url 2>/dev/null| awk nr==3 | awk '{print $1}'
}
function handled {
 $curl $url 2>/dev/null| awk nr==3 | awk '{print $2}'
}
function requests {
 $curl $url 2>/dev/null| awk nr==3 | awk '{print $3}'
}
$1添加权限:
[root@centos ~]# chmod 755 /usr/local/sbin/ngx_status.sh
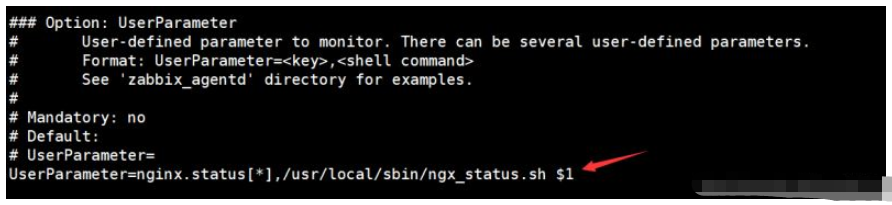
编辑zabbix_agent配置文件:
[root@centos ~]# vi /etc/zabbix/zabbix_agentd.conf
在option:userparameter处添加:userparameter=nginx.status[*],/usr/local/sbin/ngx_status.sh $1
重启服务:
[root@centos ~]# systemctl restart zabbix-agent
在a机器(服务端)测试:
[root@zabbix ~]# zabbix_get -s 192.168.234.125 -k 'nginx.status[accepts]'
6
在本机创建.xml文件并添加以下内容:(文件名称自定义)
<?xml version="1.0" encoding="utf-8"?>
<zabbix_export>
 <version>4.0</version>
 <date>2019-02-11t07:29:29z</date>
 <groups>
  <group>
   <name>templates</name>
  </group>
 </groups>
 <templates>
  <template>
   <template>template app nginx</template>
   <name>template app nginx</name>
   <description/>
   <groups>
    <group>
     <name>templates</name>
    </group>
   </groups>
   <applications>
    <application>
     <name>nginx</name>
    </application>
   </applications>
   <items>
    <item>
     <name>nginx status server accepts</name>
     <type>0</type>
     <snmp_community/>
     <snmp_oid/>
     <key>nginx.status[accepts]</key>
     <delay>60</delay>
     <history>90d</history>
     <trends>365d</trends>
     <status>0</status>
     <value_type>3</value_type>
     <allowed_hosts/>
     <units/>
     <snmpv3_contextname/>
     <snmpv3_securityname/>
     <snmpv3_securitylevel>0</snmpv3_securitylevel>
     <snmpv3_authprotocol>0</snmpv3_authprotocol>
     <snmpv3_authpassphrase/>
     <snmpv3_privprotocol>0</snmpv3_privprotocol>
     <snmpv3_privpassphrase/>
     <params/>
     <ipmi_sensor/>
     <authtype>0</authtype>
     <username/>
     <password/>
     <publickey/>
     <privatekey/>
     <port/>
     <description>accepts</description>
     <inventory_link>0</inventory_link>
     <applications>
      <application>
       <name>nginx</name>
      </application>
     </applications>
     <valuemap/>
     <logtimefmt/>
     <preprocessing>
      <step>
       <type>10</type>
       <params/>
      </step>
     </preprocessing>
     <jmx_endpoint/>
     <timeout>3s</timeout>
     <url/>
     <query_fields/>
     <posts/>
     <status_codes>200</status_codes>
     <follow_redirects>1</follow_redirects>
     <post_type>0</post_type>
     <http_proxy/>
     <headers/>
     <retrieve_mode>0</retrieve_mode>
     <request_method>0</request_method>
     <output_format>0</output_format>
     <allow_traps>0</allow_traps>
     <ssl_cert_file/>
     <ssl_key_file/>
     <ssl_key_password/>
     <verify_peer>0</verify_peer>
     <verify_host>0</verify_host>
     <master_item/>
    </item>
    <item>
     <name>nginx status connections active</name>
     <type>0</type>
     <snmp_community/>
     <snmp_oid/>
     <key>nginx.status[active]</key>
     <delay>60</delay>
     <history>90d</history>
     <trends>365d</trends>
     <status>0</status>
     <value_type>3</value_type>
     <allowed_hosts/>
     <units/>
     <snmpv3_contextname/>
     <snmpv3_securityname/>
     <snmpv3_securitylevel>0</snmpv3_securitylevel>
     <snmpv3_authprotocol>0</snmpv3_authprotocol>
     <snmpv3_authpassphrase/>
     <snmpv3_privprotocol>0</snmpv3_privprotocol>
     <snmpv3_privpassphrase/>
     <params/>
     <ipmi_sensor/>
     <authtype>0</authtype>
     <username/>
     <password/>
     <publickey/>
     <privatekey/>
     <port/>
     <description>active</description>
     <inventory_link>0</inventory_link>
     <applications>
      <application>
       <name>nginx</name>
      </application>
     </applications>
     <valuemap/>
     <logtimefmt/>
     <preprocessing/>
     <jmx_endpoint/>
     <timeout>3s</timeout>
     <url/>
     <query_fields/>
     <posts/>
     <status_codes>200</status_codes>
     <follow_redirects>1</follow_redirects>
     <post_type>0</post_type>
     <http_proxy/>
     <headers/>
     <retrieve_mode>0</retrieve_mode>
     <request_method>0</request_method>
     <output_format>0</output_format>
     <allow_traps>0</allow_traps>
     <ssl_cert_file/>
     <ssl_key_file/>
     <ssl_key_password/>
     <verify_peer>0</verify_peer>
     <verify_host>0</verify_host>
     <master_item/>
    </item>
    <item>
     <name>nginx status server handled</name>
     <type>0</type>
     <snmp_community/>
     <snmp_oid/>
     <key>nginx.status[handled]</key>
     <delay>60</delay>
     <history>90d</history>
     <trends>365d</trends>
     <status>0</status>
     <value_type>3</value_type>
     <allowed_hosts/>
     <units/>
     <snmpv3_contextname/>
     <snmpv3_securityname/>
     <snmpv3_securitylevel>0</snmpv3_securitylevel>
     <snmpv3_authprotocol>0</snmpv3_authprotocol>
     <snmpv3_authpassphrase/>
     <snmpv3_privprotocol>0</snmpv3_privprotocol>
     <snmpv3_privpassphrase/>
     <params/>
     <ipmi_sensor/>
     <authtype>0</authtype>
     <username/>
     <password/>
     <publickey/>
     <privatekey/>
     <port/>
     <description>handled</description>
     <inventory_link>0</inventory_link>
     <applications>
      <application>
       <name>nginx</name>
      </application>
     </applications>
     <valuemap/>
     <logtimefmt/>
     <preprocessing>
      <step>
       <type>10</type>
       <params/>
      </step>
     </preprocessing>
     <jmx_endpoint/>
     <timeout>3s</timeout>
     <url/>
     <query_fields/>
     <posts/>
     <status_codes>200</status_codes>
     <follow_redirects>1</follow_redirects>
     <post_type>0</post_type>
     <http_proxy/>
     <headers/>
     <retrieve_mode>0</retrieve_mode>
     <request_method>0</request_method>
     <output_format>0</output_format>
     <allow_traps>0</allow_traps>
     <ssl_cert_file/>
     <ssl_key_file/>
     <ssl_key_password/>
     <verify_peer>0</verify_peer>
     <verify_host>0</verify_host>
     <master_item/>
    </item>
    <item>
     <name>nginx status ping</name>
     <type>0</type>
     <snmp_community/>
     <snmp_oid/>
     <key>nginx.status[ping]</key>
     <delay>60</delay>
     <history>30d</history>
     <trends>365d</trends>
     <status>0</status>
     <value_type>3</value_type>
     <allowed_hosts/>
     <units/>
     <snmpv3_contextname/>
     <snmpv3_securityname/>
     <snmpv3_securitylevel>0</snmpv3_securitylevel>
     <snmpv3_authprotocol>0</snmpv3_authprotocol>
     <snmpv3_authpassphrase/>
     <snmpv3_privprotocol>0</snmpv3_privprotocol>
     <snmpv3_privpassphrase/>
     <params/>
     <ipmi_sensor/>
     <authtype>0</authtype>
     <username/>
     <password/>
     <publickey/>
     <privatekey/>
     <port/>
     <description>is live</description>
     <inventory_link>0</inventory_link>
     <applications>
      <application>
       <name>nginx</name>
      </application>
     </applications>
     <valuemap>
      <name>service state</name>
     </valuemap>
     <logtimefmt/>
     <preprocessing/>
     <jmx_endpoint/>
     <timeout>3s</timeout>
     <url/>
     <query_fields/>
     <posts/>
     <status_codes>200</status_codes>
     <follow_redirects>1</follow_redirects>
     <post_type>0</post_type>
     <http_proxy/>
     <headers/>
     <retrieve_mode>0</retrieve_mode>
     <request_method>0</request_method>
     <output_format>0</output_format>
     <allow_traps>0</allow_traps>
     <ssl_cert_file/>
     <ssl_key_file/>
     <ssl_key_password/>
     <verify_peer>0</verify_peer>
     <verify_host>0</verify_host>
     <master_item/>
    </item>
    <item>
     <name>nginx status connections reading</name>
     <type>0</type>
     <snmp_community/>
     <snmp_oid/>
     <key>nginx.status[reading]</key>
     <delay>60</delay>
     <history>90d</history>
     <trends>365d</trends>
     <status>0</status>
     <value_type>3</value_type>
     <allowed_hosts/>
     <units/>
     <snmpv3_contextname/>
     <snmpv3_securityname/>
     <snmpv3_securitylevel>0</snmpv3_securitylevel>
     <snmpv3_authprotocol>0</snmpv3_authprotocol>
     <snmpv3_authpassphrase/>
     <snmpv3_privprotocol>0</snmpv3_privprotocol>
     <snmpv3_privpassphrase/>
     <params/>
     <ipmi_sensor/>
     <authtype>0</authtype>
     <username/>
     <password/>
     <publickey/>
     <privatekey/>
     <port/>
     <description>reading</description>
     <inventory_link>0</inventory_link>
     <applications>
      <application>
       <name>nginx</name>
      </application>
     </applications>
     <valuemap/>
     <logtimefmt/>
     <preprocessing/>
     <jmx_endpoint/>
     <timeout>3s</timeout>
     <url/>
     <query_fields/>
     <posts/>
     <status_codes>200</status_codes>
     <follow_redirects>1</follow_redirects>
     <post_type>0</post_type>
     <http_proxy/>
     <headers/>
     <retrieve_mode>0</retrieve_mode>
     <request_method>0</request_method>
     <output_format>0</output_format>
     <allow_traps>0</allow_traps>
     <ssl_cert_file/>
     <ssl_key_file/>
     <ssl_key_password/>
     <verify_peer>0</verify_peer>
     <verify_host>0</verify_host>
     <master_item/>
    </item>
    <item>
     <name>nginx status server requests</name>
     <type>0</type>
     <snmp_community/>
     <snmp_oid/>
     <key>nginx.status[requests]</key>
     <delay>60</delay>
     <history>90d</history>
     <trends>365d</trends>
     <status>0</status>
     <value_type>3</value_type>
     <allowed_hosts/>
     <units/>
     <snmpv3_contextname/>
     <snmpv3_securityname/>
     <snmpv3_securitylevel>0</snmpv3_securitylevel>
     <snmpv3_authprotocol>0</snmpv3_authprotocol>
     <snmpv3_authpassphrase/>
     <snmpv3_privprotocol>0</snmpv3_privprotocol>
     <snmpv3_privpassphrase/>
     <params/>
     <ipmi_sensor/>
     <authtype>0</authtype>
     <username/>
     <password/>
     <publickey/>
     <privatekey/>
     <port/>
     <description>requests</description>
     <inventory_link>0</inventory_link>
     <applications>
      <application>
       <name>nginx</name>
      </application>
     </applications>
     <valuemap/>
     <logtimefmt/>
     <preprocessing>
      <step>
       <type>10</type>
       <params/>
      </step>
     </preprocessing>
     <jmx_endpoint/>
     <timeout>3s</timeout>
     <url/>
     <query_fields/>
     <posts/>
     <status_codes>200</status_codes>
     <follow_redirects>1</follow_redirects>
     <post_type>0</post_type>
     <http_proxy/>
     <headers/>
     <retrieve_mode>0</retrieve_mode>
     <request_method>0</request_method>
     <output_format>0</output_format>
     <allow_traps>0</allow_traps>
     <ssl_cert_file/>
     <ssl_key_file/>
     <ssl_key_password/>
     <verify_peer>0</verify_peer>
     <verify_host>0</verify_host>
     <master_item/>
    </item>
    <item>
     <name>nginx status connections waiting</name>
     <type>0</type>
     <snmp_community/>
     <snmp_oid/>
     <key>nginx.status[waiting]</key>
     <delay>60</delay>
     <history>90d</history>
     <trends>365d</trends>
     <status>0</status>
     <value_type>3</value_type>
     <allowed_hosts/>
     <units/>
     <snmpv3_contextname/>
     <snmpv3_securityname/>
     <snmpv3_securitylevel>0</snmpv3_securitylevel>
     <snmpv3_authprotocol>0</snmpv3_authprotocol>
     <snmpv3_authpassphrase/>
     <snmpv3_privprotocol>0</snmpv3_privprotocol>
     <snmpv3_privpassphrase/>
     <params/>
     <ipmi_sensor/>
     <authtype>0</authtype>
     <username/>
     <password/>
     <publickey/>
     <privatekey/>
     <port/>
     <description>waiting</description>
     <inventory_link>0</inventory_link>
     <applications>
      <application>
       <name>nginx</name>
      </application>
     </applications>
     <valuemap/>
     <logtimefmt/>
     <preprocessing/>
     <jmx_endpoint/>
     <timeout>3s</timeout>
     <url/>
     <query_fields/>
     <posts/>
     <status_codes>200</status_codes>
     <follow_redirects>1</follow_redirects>
     <post_type>0</post_type>
     <http_proxy/>
     <headers/>
     <retrieve_mode>0</retrieve_mode>
     <request_method>0</request_method>
     <output_format>0</output_format>
     <allow_traps>0</allow_traps>
     <ssl_cert_file/>
     <ssl_key_file/>
     <ssl_key_password/>
     <verify_peer>0</verify_peer>
     <verify_host>0</verify_host>
     <master_item/>
    </item>
    <item>
     <name>nginx status connections writing</name>
     <type>0</type>
     <snmp_community/>
     <snmp_oid/>
     <key>nginx.status[writing]</key>
     <delay>60</delay>
     <history>90d</history>
     <trends>365d</trends>
     <status>0</status>
     <value_type>3</value_type>
     <allowed_hosts/>
     <units/>
     <snmpv3_contextname/>
     <snmpv3_securityname/>
     <snmpv3_securitylevel>0</snmpv3_securitylevel>
     <snmpv3_authprotocol>0</snmpv3_authprotocol>
     <snmpv3_authpassphrase/>
     <snmpv3_privprotocol>0</snmpv3_privprotocol>
     <snmpv3_privpassphrase/>
     <params/>
     <ipmi_sensor/>
     <authtype>0</authtype>
     <username/>
     <password/>
     <publickey/>
     <privatekey/>
     <port/>
     <description>writing</description>
     <inventory_link>0</inventory_link>
     <applications>
      <application>
       <name>nginx</name>
      </application>
     </applications>
     <valuemap/>
     <logtimefmt/>
     <preprocessing/>
     <jmx_endpoint/>
     <timeout>3s</timeout>
     <url/>
     <query_fields/>
     <posts/>
     <status_codes>200</status_codes>
     <follow_redirects>1</follow_redirects>
     <post_type>0</post_type>
     <http_proxy/>
     <headers/>
     <retrieve_mode>0</retrieve_mode>
     <request_method>0</request_method>
     <output_format>0</output_format>
     <allow_traps>0</allow_traps>
     <ssl_cert_file/>
     <ssl_key_file/>
     <ssl_key_password/>
     <verify_peer>0</verify_peer>
     <verify_host>0</verify_host>
     <master_item/>
    </item>
   </items>
   <discovery_rules/>
   <httptests/>
   <macros/>
   <templates/>
   <screens/>
  </template>
 </templates>
 <triggers>
  <trigger>
   <expression>{template app nginx:nginx.status[ping].last()}=0</expression>
   <recovery_mode>0</recovery_mode>
   <recovery_expression/>
   <name>nginx was down!</name>
   <correlation_mode>0</correlation_mode>
   <correlation_tag/>
   <url/>
   <status>0</status>
   <priority>4</priority>
   <description>nginx进程数:0,请注意</description>
   <type>0</type>
   <manual_close>0</manual_close>
   <dependencies/>
   <tags/>
  </trigger>
 </triggers>
 <graphs>
  <graph>
   <name>nginx status connections</name>
   <width>900</width>
   <height>200</height>
   <yaxismin>0.0000</yaxismin>
   <yaxismax>100.0000</yaxismax>
   <show_work_period>1</show_work_period>
   <show_triggers>1</show_triggers>
   <type>0</type>
   <show_legend>1</show_legend>
   <show_3d>0</show_3d>
   <percent_left>0.0000</percent_left>
   <percent_right>0.0000</percent_right>
   <ymin_type_1>0</ymin_type_1>
   <ymax_type_1>0</ymax_type_1>
   <ymin_item_1>0</ymin_item_1>
   <ymax_item_1>0</ymax_item_1>
   <graph_items>
    <graph_item>
     <sortorder>0</sortorder>
     <drawtype>0</drawtype>
     <color>00c800</color>
     <yaxisside>0</yaxisside>
     <calc_fnc>2</calc_fnc>
     <type>0</type>
     <item>
      <host>template app nginx</host>
      <key>nginx.status[active]</key>
     </item>
    </graph_item>
    <graph_item>
     <sortorder>1</sortorder>
     <drawtype>0</drawtype>
     <color>c80000</color>
     <yaxisside>0</yaxisside>
     <calc_fnc>2</calc_fnc>
     <type>0</type>
     <item>
      <host>template app nginx</host>
      <key>nginx.status[reading]</key>
     </item>
    </graph_item>
    <graph_item>
     <sortorder>2</sortorder>
     <drawtype>0</drawtype>
     <color>0000c8</color>
     <yaxisside>0</yaxisside>
     <calc_fnc>2</calc_fnc>
     <type>0</type>
     <item>
      <host>template app nginx</host>
      <key>nginx.status[waiting]</key>
     </item>
    </graph_item>
    <graph_item>
     <sortorder>3</sortorder>
     <drawtype>0</drawtype>
     <color>c800c8</color>
     <yaxisside>0</yaxisside>
     <calc_fnc>2</calc_fnc>
     <type>0</type>
     <item>
      <host>template app nginx</host>
      <key>nginx.status[writing]</key>
     </item>
    </graph_item>
   </graph_items>
  </graph>
  <graph>
   <name>nginx status server</name>
   <width>900</width>
   <height>200</height>
   <yaxismin>0.0000</yaxismin>
   <yaxismax>100.0000</yaxismax>
   <show_work_period>1</show_work_period>
   <show_triggers>1</show_triggers>
   <type>0</type>
   <show_legend>1</show_legend>
   <show_3d>0</show_3d>
   <percent_left>0.0000</percent_left>
   <percent_right>0.0000</percent_right>
   <ymin_type_1>0</ymin_type_1>
   <ymax_type_1>0</ymax_type_1>
   <ymin_item_1>0</ymin_item_1>
   <ymax_item_1>0</ymax_item_1>
   <graph_items>
    <graph_item>
     <sortorder>0</sortorder>
     <drawtype>0</drawtype>
     <color>00c800</color>
     <yaxisside>0</yaxisside>
     <calc_fnc>2</calc_fnc>
     <type>0</type>
     <item>
      <host>template app nginx</host>
      <key>nginx.status[accepts]</key>
     </item>
    </graph_item>
    <graph_item>
     <sortorder>1</sortorder>
     <drawtype>0</drawtype>
     <color>c80000</color>
     <yaxisside>0</yaxisside>
     <calc_fnc>2</calc_fnc>
     <type>0</type>
     <item>
      <host>template app nginx</host>
      <key>nginx.status[handled]</key>
     </item>
    </graph_item>
    <graph_item>
     <sortorder>2</sortorder>
     <drawtype>0</drawtype>
     <color>0000c8</color>
     <yaxisside>0</yaxisside>
     <calc_fnc>2</calc_fnc>
     <type>0</type>
     <item>
      <host>template app nginx</host>
      <key>nginx.status[requests]</key>
     </item>
    </graph_item>
   </graph_items>
  </graph>
 </graphs>
 <value_maps>
  <value_map>
   <name>service state</name>
   <mappings>
    <mapping>
     <value>0</value>
     <newvalue>down</newvalue>
    </mapping>
    <mapping>
     <value>1</value>
     <newvalue>up</newvalue>
    </mapping>
   </mappings>
  </value_map>
 </value_maps>
</zabbix_export>在zabbix前端页面点击配置→模板→导入:
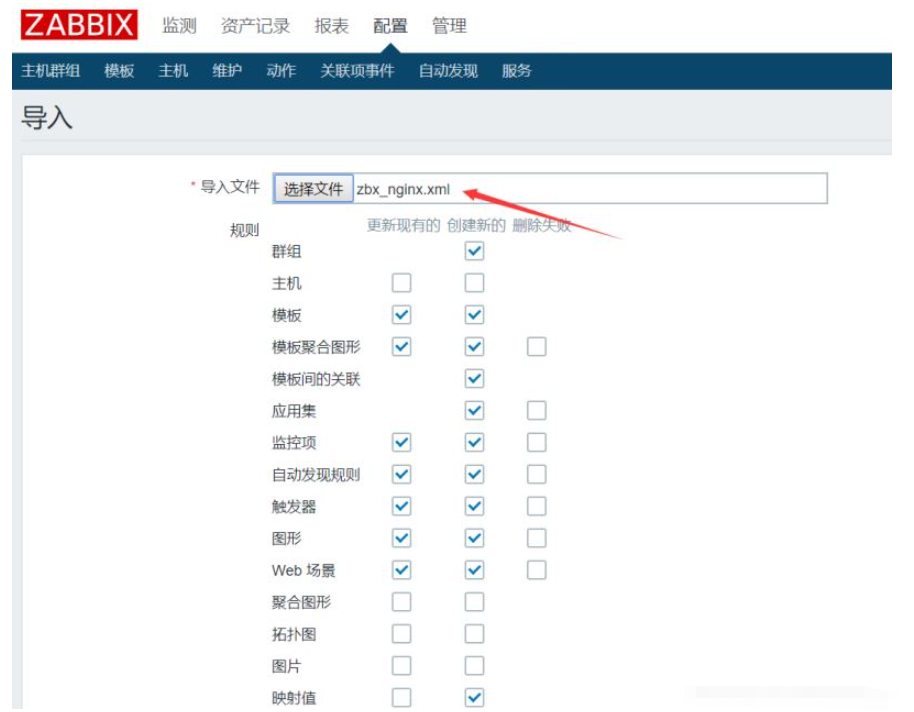
#导入刚才创建的xml文件即可
导入成功后在主机列表页面选择被监控的机器(b机器)链接该模板即可开始监控nginx
zabbix监控tomcat
a机器:zabbix服务端(192.168.234.128) b机器:zabbix客户端(192.168.234.125)
在a机器安装zabbix-java-gateway:
[root@zabbix ~]# wget https://mirrors.tuna.tsinghua.edu.cn/zabbix/zabbix/4.0/rhel/7/x86_64/zabbix-java-gateway-4.0.14-1.el7.x86_64.rpm

[root@zabbix ~]# yum -y localinstall zabbix-java-gateway-4.0.14-1.el7.x86_64.rpm
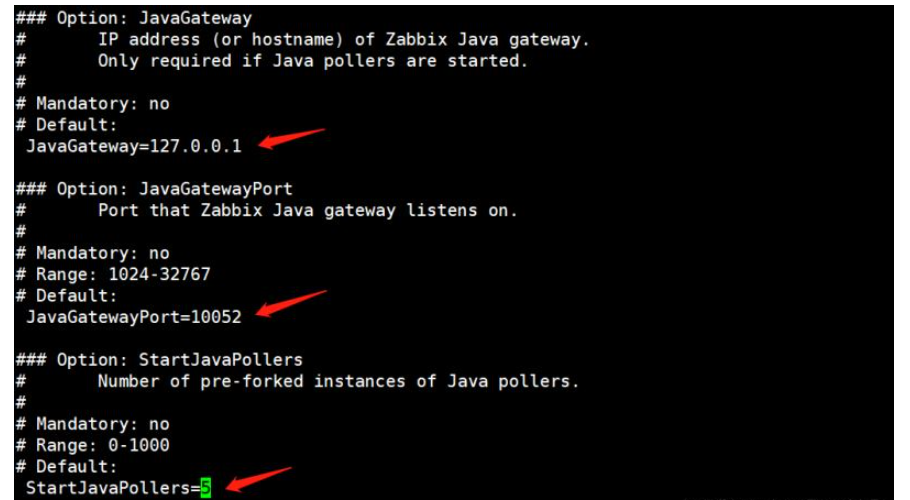
编辑gateway配置文件:
[root@zabbix ~]# vi /etc/zabbix/zabbix_java_gateway.conf
去掉listen_ip、listen_port(监听端口)、start_pollers(进程数)的注释符号#:
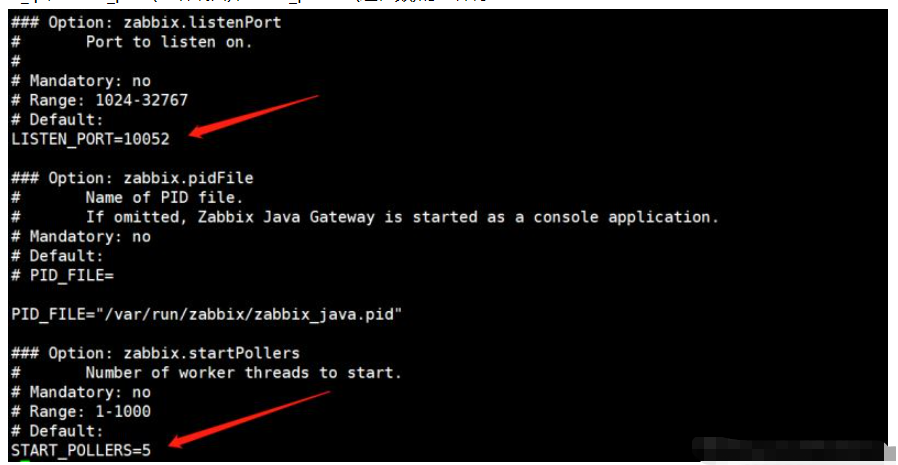
#listen_ip定义被监控机器的地址,不指定默认监听全部机器
编辑server配置文件:
[root@zabbix ~]# vi /etc/zabbix/zabbix_server.conf
定义以下3个配置参数:
启动zabbix-java-gateway服务:
[root@zabbix ~]# systemctl start zabbix-java-gateway
重启zabbix-server服务:
[root@zabbix ~]# systemctl restart zabbix-server
查看监听端口:
[root@zabbix ~]# netstat -lntp |grep java
tcp6  0  0 :::10052    :::*     listen  8706/java
开启jmx
在b机器编辑tomcat配置文件:
[root@centos ~]# vi /usr/local/tomcat/bin/catalina.sh
添加以下内容:
export catalina_opts="$catalina_opts -dcom.sun.management.jmxremote
-djava.rmi.server.hostname=192.168.234.125
-dcom.sun.management.jmxremote.port=9999
-dcom.sun.management.jmxremote.ssl=false
-dcom.sun.management.jmxremote.authenticate=false"
#hostname定义b机器地址,端口9999(默认12345)
重启tomcat:
[root@centos ~]# /usr/local/tomcat/bin/shutdown.sh

[root@centos ~]# /usr/local/tomcat/bin/startup.sh
查看监听端口9999:
[root@centos ~]# netstat -lntp |grep 9999
tcp6  0  0 :::9999     :::*     listen  25861/java
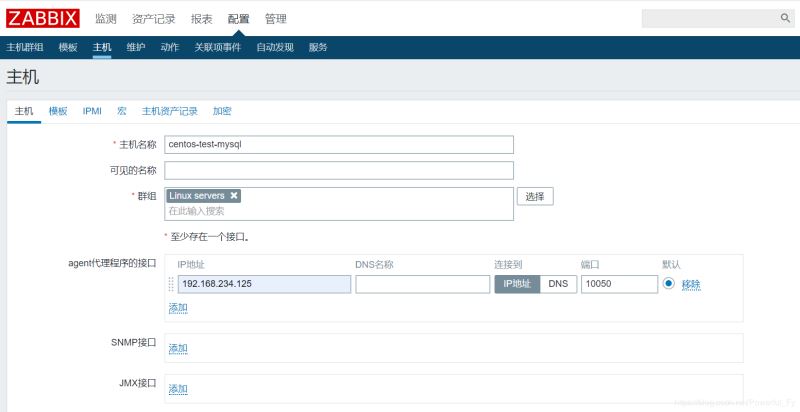
进入zabbix前端页面添加主机:
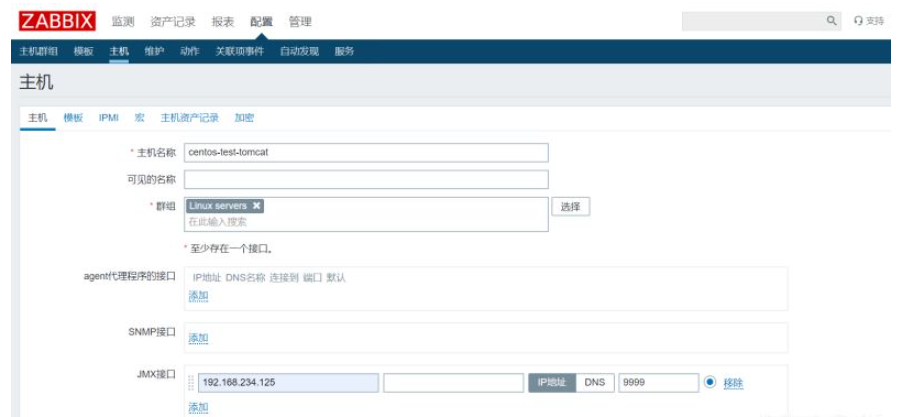
#与普通情况添加监控主机不同,监控b机器的tomcat需要配置jmx接口
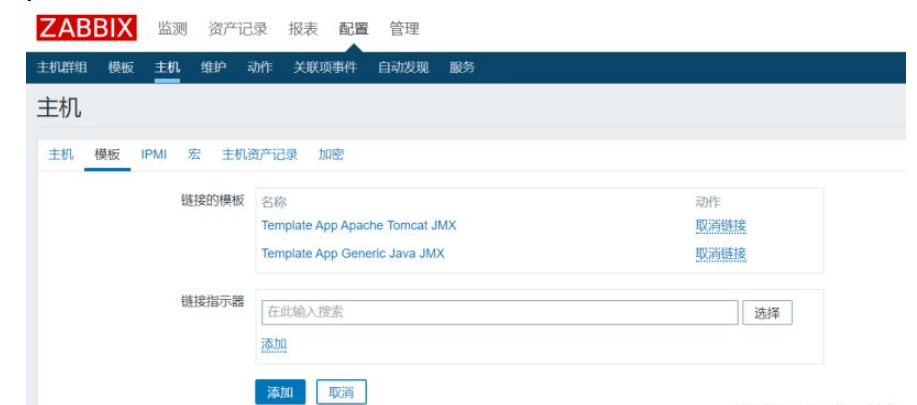
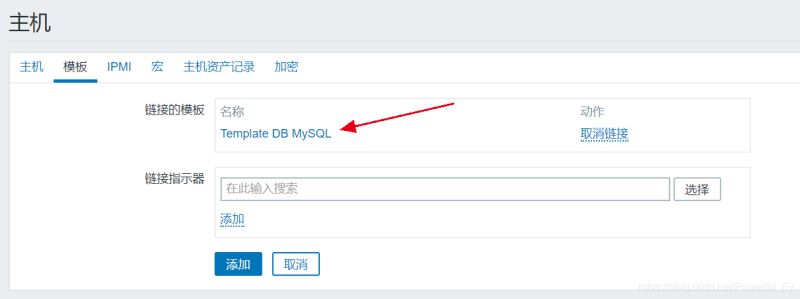
模板链接jmx相关的两个模板:
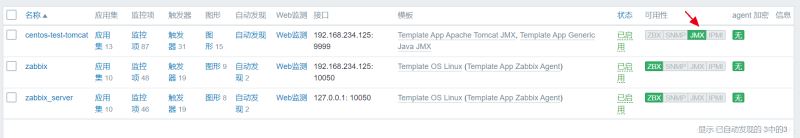
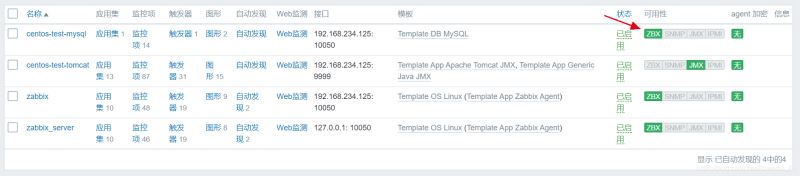
当jmx图标变绿即表示配置成功:
zabbix监控mysql
a机器:zabbix服务端(192.168.234.128) b机器:zabbix客户端(192.168.234.125)
zabbix_agent定义mysql监控的配置文件:/etc/zabbix/zabbix_agentd.d/userparameter_mysql.conf
在b机器登录mysql创建用户:
mysql> grant usage,process,replication client on *.* to zamysql@'localhost' identified by 'zamysql';
创建配置文件指定的目录:
[root@centos ~]# mkdir /var/lib/zabbix
创建my.cnf文件:
[root@centos ~]# vi /var/lib/zabbix/.my.cnf
#需要注意该文件是隐藏文件
添加以下内容:
[mysql]
host=localhost
user=zamysql
password='zamysql'
socket=/tmp/mysql.sock

[mysqladmin]
host=localhost
user=zamysql
password='zamysql'
socket=/tmp/mysql.sock
在a机器测试:
[root@zabbix ~]# zabbix_get -s 192.168.234.125 -p 10050 -k mysql.ping
1
[root@zabbix ~]# zabbix_get -s 192.168.234.125 -p 10050 -k mysql.version
mysql ver 14.14 distrib 5.6.43, for linux-glibc2.12 (x86_64) using editline wrapper
[root@zabbix ~]# zabbix_get -s 192.168.234.125 -p 10050 -k mysql.size
10240
#已成功获取数据
在zabbix前端页面添加主机:
监控模板选择db mysql:
zbx标准变为绿色表示成功:
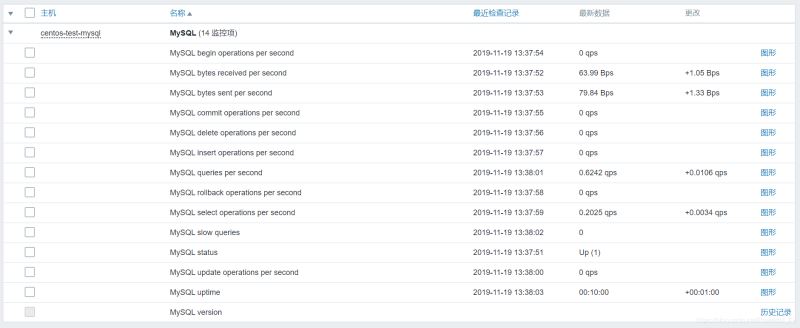
在监测→最新数据页面即可查看mysql监控数据:
Ce qui précède est le contenu détaillé de. pour plus d'informations, suivez d'autres articles connexes sur le site Web de PHP en chinois!

Outils d'IA chauds

Undresser.AI Undress
Application basée sur l'IA pour créer des photos de nu réalistes

AI Clothes Remover
Outil d'IA en ligne pour supprimer les vêtements des photos.

Undress AI Tool
Images de déshabillage gratuites

Clothoff.io
Dissolvant de vêtements AI

AI Hentai Generator
Générez AI Hentai gratuitement.

Article chaud
Outils chauds

Bloc-notes++7.3.1
Éditeur de code facile à utiliser et gratuit

SublimeText3 version chinoise
Version chinoise, très simple à utiliser

Envoyer Studio 13.0.1
Puissant environnement de développement intégré PHP

Dreamweaver CS6
Outils de développement Web visuel

SublimeText3 version Mac
Logiciel d'édition de code au niveau de Dieu (SublimeText3)


 Comment déployer plusieurs projets dans Tomcat
Apr 21, 2024 am 09:33 AM
Comment déployer plusieurs projets dans Tomcat
Apr 21, 2024 am 09:33 AM
Pour déployer plusieurs projets via Tomcat, vous devez créer un répertoire webapp pour chaque projet puis : Déploiement automatique : Placez le répertoire webapp dans le répertoire webapps de Tomcat. Déploiement manuel : déployez manuellement le projet dans l'application de gestion de Tomcat. Une fois le projet déployé, il est accessible par son nom de déploiement, par exemple : http://localhost:8080/project1.
 Comment configurer le nom de domaine dans Tomcat
Apr 21, 2024 am 09:52 AM
Comment configurer le nom de domaine dans Tomcat
Apr 21, 2024 am 09:52 AM
Pour configurer Tomcat pour utiliser un nom de domaine, procédez comme suit : Créez une sauvegarde server.xml. Ouvrez server.xml et ajoutez l'élément Host, en remplaçant example.com par votre nom de domaine. Créez un certificat SSL pour le nom de domaine (si nécessaire). Ajoutez un connecteur SSL dans server.xml, modifiez le port, le fichier de clés et le mot de passe. Enregistrez le fichier serveur.xml. Redémarrez Tomcat.
 Comment générer une URL à partir d'un fichier HTML
Apr 21, 2024 pm 12:57 PM
Comment générer une URL à partir d'un fichier HTML
Apr 21, 2024 pm 12:57 PM
La conversion d'un fichier HTML en URL nécessite un serveur Web, ce qui implique les étapes suivantes : Obtenir un serveur Web. Configurez un serveur Web. Téléchargez le fichier HTML. Créez un nom de domaine. Acheminez la demande.
 Raisons des caractères tronqués dans Tomcat
Apr 21, 2024 am 10:18 AM
Raisons des caractères tronqués dans Tomcat
Apr 21, 2024 am 10:18 AM
Raisons des caractères tronqués de Tomcat : 1. Incompatibilité des jeux de caractères ; 2. L'en-tête de la réponse HTTP n'est pas défini correctement ; 3. Erreur de configuration du filtre ou de l'encodeur 4. Le codage de la page Web est incorrect ; problèmes d'encodage et de serveur proxy).
 Comment ajouter un serveur dans Eclipse
May 05, 2024 pm 07:27 PM
Comment ajouter un serveur dans Eclipse
May 05, 2024 pm 07:27 PM
Pour ajouter un serveur à Eclipse, procédez comme suit : Créer un environnement d'exécution du serveur Configurer le serveur Créer une instance de serveur Sélectionner l'environnement d'exécution du serveur Configurer l'instance de serveur Démarrer le projet de déploiement du serveur
 Comment accéder à la page après le démarrage de Tomcat
Apr 21, 2024 am 10:30 AM
Comment accéder à la page après le démarrage de Tomcat
Apr 21, 2024 am 10:30 AM
Pour accéder à la page après le démarrage de Tomcat, vous devez : démarrer le serveur Tomcat ; déterminer le numéro de port (par défaut 8080) ; épisser l'URL, y compris l'adresse IP, le numéro de port et le chemin de la page ; URL ; identifier la page d'accueil de Tomcat ; Utiliser le même format pour accéder aux autres pages.
 Comment déployer et maintenir un site Web en utilisant PHP
May 03, 2024 am 08:54 AM
Comment déployer et maintenir un site Web en utilisant PHP
May 03, 2024 am 08:54 AM
Pour déployer et maintenir avec succès un site Web PHP, vous devez effectuer les étapes suivantes : Sélectionnez un serveur Web (tel qu'Apache ou Nginx) Installez PHP Créez une base de données et connectez PHP Téléchargez le code sur le serveur Configurez le nom de domaine et la maintenance du site Web de surveillance DNS les étapes comprennent la mise à jour de PHP et des serveurs Web, la sauvegarde du site Web, la surveillance des journaux d'erreurs et la mise à jour du contenu.
 Comment utiliser Fail2Ban pour protéger votre serveur contre les attaques par force brute
Apr 27, 2024 am 08:34 AM
Comment utiliser Fail2Ban pour protéger votre serveur contre les attaques par force brute
Apr 27, 2024 am 08:34 AM
Une tâche importante pour les administrateurs Linux est de protéger le serveur contre les attaques ou les accès illégaux. Par défaut, les systèmes Linux sont livrés avec des pare-feu bien configurés, tels que iptables, Uncomplicated Firewall (UFW), ConfigServerSecurityFirewall (CSF), etc., qui peuvent empêcher diverses attaques. Toute machine connectée à Internet est une cible potentielle d'attaques malveillantes. Il existe un outil appelé Fail2Ban qui peut être utilisé pour atténuer les accès illégaux sur le serveur. Qu’est-ce que Fail2Ban ? Fail2Ban[1] est un logiciel de prévention des intrusions qui protège les serveurs des attaques par force brute. Il est écrit en langage de programmation Python
