The grid
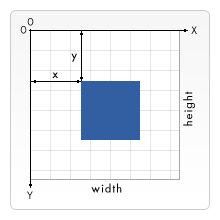
Before we really start, we need to discuss the grid or coordinate space of canvas. In the HTML template of the previous page, there is a canvas object that is 150 pixels wide and 150 pixels high. I superimposed the default grid on the screen, as shown on the right. Usually 1 unit of the grid corresponds to 1 pixel on the canvas. The origin of the grid is positioned at the upper left corner (coordinates (0,0)). The positions of all objects in the picture are relative to this origin. In this way, the position of the blue square in the upper left corner is x pixels from the left and Y pixels from the top (coordinates (x, y)). In later tutorials we will learn how to move the origin, rotate and scale the mesh. But for now we will use the default state.

Drawing shapes
canvas only supports one basic shape - rectangle, so other shapes are composed of one or more paths . Fortunately, there is a set of path drawing functions that allow us to draw quite complex shapes.
Rectangles
Let’s look at rectangles first. There are three functions used to draw rectangles:
fillRect(x,y,width,height) : Draws a filled rectangle
strokeRect(x,y,width,height) : Draws a rectangular outline
clearRect(x,y,width,height) : Clears the specified area and makes it fully transparent
They all accept four parameters, x and y Specifies the position of the upper left corner of the rectangle (relative to the origin), width and height are the width and height of the rectangle. Okay, let’s try it out.
Example of drawing a rectangleRectangular shape example
function draw(){
  var canvas = document.getElementById('tutorial');
  if (canvas.getContext){
    var ctx = canvas.getContext('2d');

    ctx.fillRect(25,25,100,100);
    ctx.clearRect(45,45,60,60);
    ctx.strokeRect(50,50,50,50);
  }
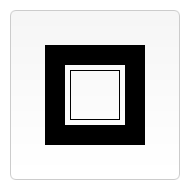
}The result should be the same as the one below of. The fillRect
function draws a large black rectangle (100x100), the clearRect
function clears the 60x60 square in the middle, and then the strokeRect
function outlines a 50x50 rectangular border in the cleared space. In the next page, we will see two other methods similar to the clearRect
function, and how to change the fill and border colors of graphics.

Drawing paths drawing paths
Unlike drawing a rectangle, drawing a path requires some extra steps.
beginPath()
closePath()
stroke()
fill()
The first step is to create a path with beginPath
. In memory, paths are stored in the form of a set of sub-paths (lines, arcs, etc.), which together form a graphic. Each time beginPath
is called, the subpath group is reset and new graphics can then be drawn.
The second step is the actual drawing of the path, as we'll see shortly.
The third step is to call the closePath
method, which will try to connect the current endpoint and the starting endpoint with a straight line to close the path, but if the graphic has been closed or there is only one point, it will do nothing. This step is not necessary.
The last step is to call the stroke or fill method. At this time, the graphics is actually drawn on the canvas. Stroke is the border for drawing graphics, and fill will fill a solid graphics.
Note: When fill is called, the open path will be automatically closed without calling closePath.
The code to draw a simple shape (such as a triangle) is as follows.
ctx.beginPath();
ctx.moveTo(75,50);
ctx.lineTo(100,75);
ctx.lineTo(100,25);
ctx.fill();
moveTo
is a very useful method. Although it cannot be used to draw anything, it is part of the practical method of drawing paths. You can think of it as lifting a pen and moving it from one point to another. It accepts x
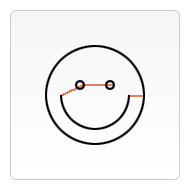
and y (the new coordinate position) as parameters. When canvas is initialized or beginPath is called, the starting coordinate setting is the origin (0,0). In most cases, we use the moveTo method to move the starting coordinates to other places, or to draw discontinuous paths. Look at the smiley face below. The red line is the trajectory moved using moveTo.

ctx.beginPath();
ctx.arc(75,75,50,0,Math.PI*2,true); // Outer circle
ctx.moveTo(110,75);
ctx.arc(75,75,35,0,Math.PI,false);   // Mouth (clockwise)
ctx.moveTo(65,65);
ctx.arc(60,65,5,0,Math.PI*2,true);  // Left eye
ctx.moveTo(95,65);
ctx.arc(90,65,5,0,Math.PI*2,true);  // Right eye
ctx.stroke();

ctx.beginPath();
ctx.moveTo(40,75);
ctx.lineTo(60,65);
ctx.lineTo(90,65);
ctx.moveTo(110,75);
ctx.lineTo(125,75);
ctx.stroke();
我们用lineTo方法来画直线。lineTo方法接受终点的坐标(x,y)作为参数。起始坐标取决于前一路径,前一路径的终点即当前路径的起点,起始坐标也可以通过moveTo方法来设置。示例(如下图)画的是两个三角形,一个实色填充,一个勾边。首先调用beginPath方法创建一个新路径,然后用moveTo方法将起始坐标移至想要的位置,然后画两条直线来构成三角形的两条边。
// 填充三角形
ctx.beginPath();
ctx.moveTo(25,25);
ctx.lineTo(105,25);
ctx.lineTo(25,105);
ctx.fill();

// 勾边三角形
ctx.beginPath();
ctx.moveTo(125,125);
ctx.lineTo(125,45);
ctx.lineTo(45,125);
ctx.closePath();
ctx.stroke();
弧线 Arcs
我们用arc方法来绘制弧线或圆。标准说明中还包含arcTo方法,当前 Safari 是支持的,但基于 Gecko 的浏览器还未实现。方法接受五个参数:x,y 是圆心坐标,radius 是半径,startAngle和endAngle分别是起末弧度(以 x 轴为基准),anticlockwise为 true 表示逆时针,反之顺时针。警告:在 Firefox 的 beta 版本里,最后一个参数是clockwise,而最终版本不是。因此如果是从 beta 升级至发行版需要做相应修改。
注意:arc方法里用到的角度是以弧度为单位而不是度。度和弧度直接的转换可以用这个表达式:var radians = (Math.PI/180)*degrees;。
arc(x, y, radius, startAngle, endAngle, anticlockwise)
arc
的使用示例

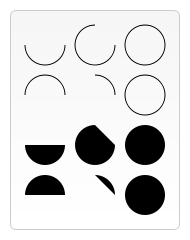
这个示例比之前见到过的要复杂一些,画了12个不同的弧形,有不同夹角和填充状态的。如果我用上面画笑脸的方式来画这些弧形,那会是一大段的代码,而且, 画每一个弧形时我都需要知道其圆心位置。像我这里画 90,180 和 270 度的弧形看起来不是很麻烦,但是如果图形更复杂一些,则实现起来会越来越困难。这里使用两个for
循环来画多行多列的弧形。每一个弧形都用beginPath方法创建一个新路径。然后为了方便阅读和理解,我把所有参数都写成变量形式。显而易见,x 和 y 作为圆心坐标。radius和startAngle都是固定,endAngle从 180 度半圆开始,以 90 度方式递增至圆。anticlockwise则取决于奇偶行数。最后,通过 if语句判断使前两行表现为勾边,而后两行为填充效果。
for (i=0;i<4;i++){
   for(j=0;j<3;j++){    //chinese_xu 原始代码
    ctx.beginPath();
    var x              = 25+j*50;               // x coordinate
    var y              = 25+i*50;               // y coordinate
    var radius         = 20;                    // Arc radius
    var startAngle     = 0;                     // Starting point on circle
    var endAngle       = Math.PI+(Math.PI*j)/2;  // End point on circle ---//修复错误标点
    var anticlockwise  = i%2==0 ? false : true; // clockwise or anticlockwise

    ctx.arc(x,y,radius,startAngle,endAngle, anticlockwise);

    if (i>1){
      ctx.fill();
    } else {
      ctx.stroke();
    }
  }
}
//chinese_xu 原始代码并没有按照1/4圆递增来画。
//修改后输出4行4列,要把画布扩大到200*200观看
for (i=0;i<4;i++){
   for(j=0;j<4;j++){
    ctx.beginPath();
    var x              = 25+j*50;               // x coordinate
    var y              = 25+i*50;               // y coordinate
    var radius         = 20;                    // Arc radius
    var startAngle     = 0;                     // Starting point on circle
    var endAngle       = Math.PI*(2-j/2);   // End point on circle
    var anticlockwise  = i%2==0 ? false : true; // clockwise or anticlockwise

    ctx.arc(x,y,radius,startAngle,endAngle, anticlockwise);

    if (i>1){
      ctx.fill();
    } else {
      ctx.stroke();
    }
  }
}以上就是canvas游戏开发学习之二:绘制基本图形的内容,更多相关内容请关注PHP中文网(www.php.cn)!
 What are the production methods of html5 animation production?
 How to restore IE browser to automatically jump to EDGE
 How to clean the C drive when it turns red
 Website domain name valuation tool
 What does write refer to in python?
 How to hide drive letter
 How to configure phpstudy
 Thunder 7 crack patch


