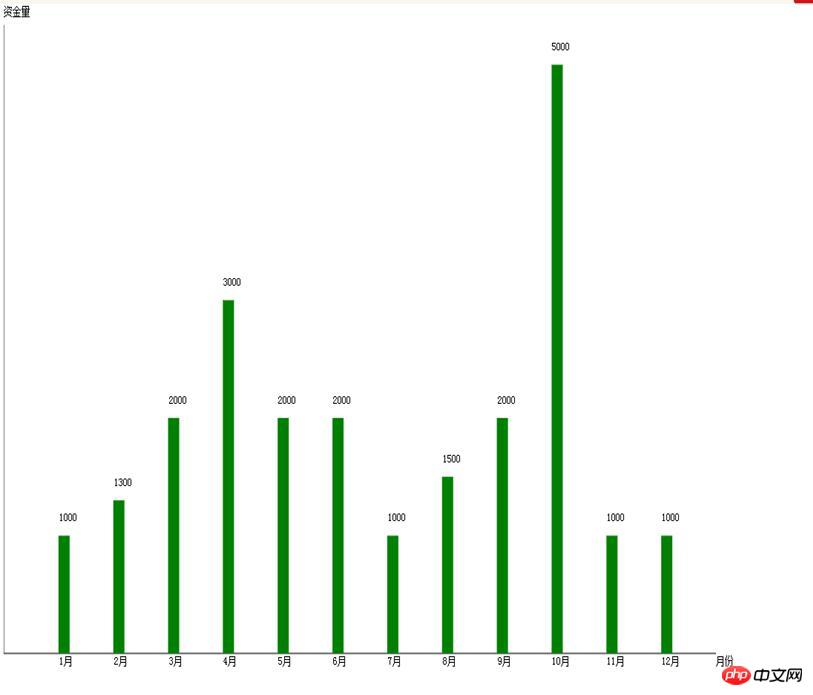
The editor below will share with you an example code for generating a histogram (bar chart) effect in HTML5. The editor thinks it’s pretty good, so I’d like to share it with you now and give you a reference. Let’s follow the editor to take a look
XML/HTML CodeCopy content to the clipboard
<html>
<canvas id="a_canvas" width="1000" height="700"></canvas>
<script>
(function (){
window.addEventListener("load", function(){
var data = [1000,1300,2000,3000,2000,2000,1000,1500,2000,5000,1000,1000];
var xinforma = ['1月','2月','3月','4月','5月','6月','7月','8月','9月','10月','11月','12月'];
// 获取上下文
var a_canvas = document.getElementById('a_canvas');
var context = a_canvas.getContext("2d");
// 绘制背景
var gradient = context.createLinearGradient(0,0,0,300);
// gradient.addColorStop(0,"#e0e0e0");
//gradient.addColorStop(1,"#ffffff");
context.fillStyle = gradient;
context.fillRect(0,0,a_canvas.width,a_canvas.height);
var realheight = a_canvas.height-15;
var realwidth = a_canvas.width-40;
// 描绘边框
var grid_cols = data.length + 1;
var grid_rows = 4;
var cell_height = realheight / grid_rows;
var cell_width = realwidth / grid_cols;
context.lineWidth = 1;
context.strokeStyle = "#a0a0a0";
// 结束边框描绘
context.beginPath();
// 准备画横线
/*for(var row = 1; row <= grid_rows; row++){
var y = row * cell_height;
context.moveTo(0,y);
context.lineTo(a_canvas.width, y);
}*/
//划横线
context.moveTo(0,realheight);
context.lineTo(realwidth,realheight);
//画竖线
context.moveTo(0,20);
context.lineTo(0,realheight);
context.lineWidth = 1;
context.strokeStyle = "black";
context.stroke();
var max_v =0;
for(var i = 0; i<data.length; i++){
if (data[i] > max_v) { max_v =data[i]};
}
max_vmax_v = max_v * 1.1;
// 将数据换算为坐标
var points = [];
for( var i=0; i < data.length; i++){
var v= data[i];
var px = cell_width * (i +1);
var py = realheight - realheight*(v / max_v);
//alert(py);
points.push({"x":px,"y":py});
}
//绘制坐标图形
for(var i in points){
var p = points[i];
context.beginPath();
context.fillStyle="green";
context.fillRect(p.x,p.y,15,realheight-p.y);
context.fill();
}
//添加文字
for(var i in points)
{ var p = points[i];
context.beginPath();
context.fillStyle="black";
context.fillText(data[i], p.x + 1, p.y - 15);
context.fillText(xinforma[i],p.x + 1,realheight+12);
context.fillText('月份',realwidth,realheight+12);
context.fillText('资金量',0,10);
}
},false);
})();
</script>
</html>html5 generation Histogram (bar chart) detailed code
Running results:

Related recommendations:
html5 touch event to achieve touch Swipe the screen up and down (1)
The above is the detailed content of Example code for generating histogram (bar chart) effect in html5. For more information, please follow other related articles on the PHP Chinese website!
 What are the production methods of html5 animation production?
 The difference between HTML and HTML5
 shib coin latest news
 How to solve the problem of slow server domain name transfer
 How to set a scheduled shutdown in UOS
 What can TikTok friends do?
 Usage of qsort function
 Introduction to python higher-order functions
 How to find the greatest common divisor in C language


