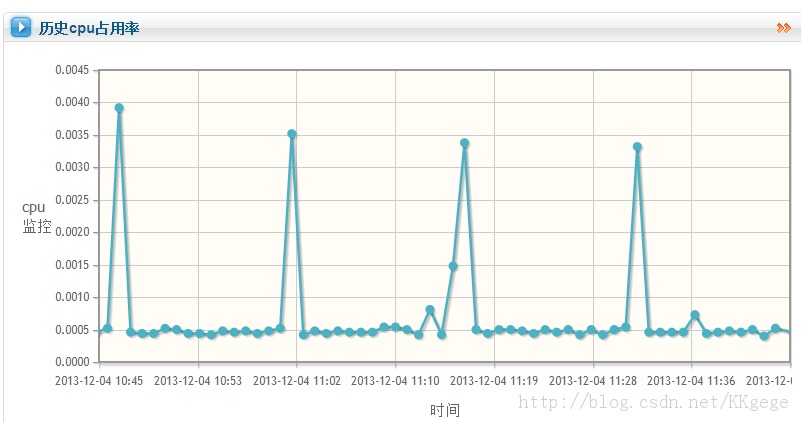
効果は図の通り、5秒ごとに絵が動き(実際には新しい絵が描かれます)、監視しているCPUの情報を表示することができます。
pastCpuInfomation 関数は主に折れ線グラフを表示するために使用されます
updateCpuPic 関数は、5 秒前の画像を削除し、既存のデータに基づいて新しい画像を描画します。
updateCpuInfomation 関数は、ポリラインを格納する配列に最新のポイントを追加します
次に、インターフェイスで 2 つのタイマーを設定し、updateCpuPic を 5 秒ごとに、updateCpuInfomation を 1 分ごとに実行するように依頼すると、画像が動き始めます。
追記: コード内で多くの操作を実行する前に、サーバーの現在時刻をサーバーから取得します。ajax の記述は少し面倒で、動的に実装する方法が標準化されているかどうかはわかりません。グラフィックはあまり良くないようです。ラインデータを直接更新できれば、友達がアドバイスをくれることを願っています。テーブルを描画するためのコードは赤でマークされています(30 行目から 60 行目)
var past_cpu_service_statistics_line = new Array();
var Lot;
function pastCpuInfomation() {
// 過去の CPU データ
// 現地時間
$ .ajax({
type: "POST",
contentType: "application/x-www-form-urlencoded;charset=UTF-8",
url: globalObj.path '/server/getServerCurrentTime. htm',
success: function(currentTime){
console.log("Get server time" currentTime);
//履歴 CPU データを取得
$.ajax({
Type : "POST",
contentType: "application/x-www-form-urlencoded;charset=UTF-8",
url: globalObj.path '/server/getPastCpuMonitorData.htm',
// startTime endtime はダミーデータであり、時刻はバックグラウンドで取得されます
// int に時刻を取得しに行きます
var Intkey = PARSEINT (key)
VAR TransferTime = New Date (intKey); ;
コンソール。ログ ("TRANSFERTIME:" Key "---- -resut:" transferTime);
var onePoint = [transferTime, result[key] ];
past_cpu_service_statistics_line.push(onePoint);
}
stos
renderer:$ .jqplot.dateaxisrenderer、
フォーマットストリング: '%y - %#m-%d%h:%m' }、
min:(currenttime -1000 * 60 * 60)、
max:(CurrentTime)、
// horizontal(垂直)最小値
yaxis:{
🎜>、
show: true、
ハイライター: {
sizeAdjust : 7.5
}
});
}
}) ; 履歴 CPU データ ajax end
},
error: function(textStatus){
アラート("履歴 CPU データの取得に失敗しました!") );
function updateCpuPic() {
console.log("Updating cpu view");
// まずサーバー時間を取得し、それを使用して横軸を描画します
$.ajax({
type: "POST",
contentType: "application/x-www-form-urlencoded;charset=UTF-8",
url: globalObj.path '/server/getServerCurrentTime .htm',
success : function(result){
var intKey =parseInt(result);
var transferTime = new Date(intKey);
console.log("サーバー時刻の取得: " result "------ 「transferTime);
;
}
:{ label: 'time'、
renderer:$ .jqplot.dateaxisrenderer、
}、
60 * 60)、
max:(result)、
>
// 水平(垂直)座標で表示される最小値
// Nicks:['']
},
yaxis: {
label: 'cpu Monitoring' ,
}
} ,
ハイライター: {
表示: true,
サイズ調整: 7.5
},
カーソル: {
表示: false
},
replot: {
resetAxes: true
🎜> error: function(textStatus){
alert("サーバー時刻の取得に失敗しました!");
function updateCpuInfomation() {
$.ajax({
type: "POST",
contentType: "application/x-www-form-urlencoded;charset=UTF-8" ,
url: globalObj.path '/server/getLatestCpuMonitorData.htm',
data: "hostName=" "login.cheos.cn",
success: function(result){
// Update the data once
for (key in result) {
var intKey = parseInt(key);
var transferTime = new Date(intKey);
console.log("- ----- ----------Update cpu information---:" key "----Update time:" transferTime);
var onePoint = [transferTime, result[key]]; .push(onePoint);
}
alert("Update cpu information Failed!");
}
});
}

