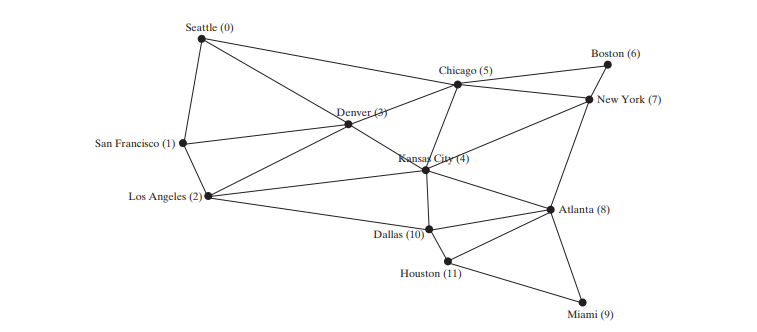
グラフを視覚的に表示するには、各頂点に位置を割り当てる必要があります。前のセクションでは、Graph インターフェイス、AbstractGraph クラス、および UnweightedGraph クラスを使用してグラフをモデル化する方法を紹介しました。このセクションでは、グラフをグラフィカルに表示する方法について説明します。グラフを表示するには、各頂点が表示される場所と各頂点の名前を知る必要があります。グラフを確実に表示できるようにするために、x- および y- 座標とその名前を取得するメソッドを備えた Displayable という名前のインターフェイスを定義します。以下のコードで、Displayable の頂点インスタンスを作成します。

以下のコードに示すように、Displayable 頂点を持つグラフを GraphView という名前のペインに表示できるようになりました。

ペインにグラフを表示するには、コンストラクターの引数としてグラフを渡して、GraphView のインスタンスを作成するだけです (9 行目)。グラフの頂点のクラスは、頂点を表示するために Displayable インターフェイスを実装する必要があります (13 ~ 22 行目)。各頂点インデックス i について、graph.getNeighbors(i) を呼び出すと、その隣接リストが返されます (26 行目)。このリストから、i に隣接するすべての頂点を見つけて、i とその隣接する頂点を結ぶ線を引くことができます (行 27 ~ 34)。

以下のコードは、上図のグラフを下図のように表示する例を示します。

import javafx.application.Application;
import javafx.scene.Scene;
import javafx.stage.Stage;

public class DisplayUSMap extends Application {
    @Override // Override the start method in the Application class
    public void start(Stage primaryStage) {
        City[] vertices = {new City("Seattle", 75, 50),
                new City("San Francisco", 50, 210),
                new City("Los Angeles", 75, 275), new City("Denver", 275, 175),
                new City("Kansas City", 400, 245),
                new City("Chicago", 450, 100), new City("Boston", 700, 80),
                new City("New York", 675, 120), new City("Atlanta", 575, 295),
                new City("Miami", 600, 400), new City("Dallas", 408, 325),
                new City("Houston", 450, 360)};

        // Edge array for graph
        int[][] edges = {
                {0, 1}, {0, 3}, {0, 5}, {1, 0}, {1, 2}, {1, 3},
                {2, 1}, {2, 3}, {2, 4}, {2, 10},
                {3, 0}, {3, 1}, {3, 2}, {3, 4}, {3, 5},
                {4, 2}, {4, 3}, {4, 5}, {4, 7}, {4, 8}, {4, 10},
                {5, 0}, {5, 3}, {5, 4}, {5, 6}, {5, 7},
                {6, 5}, {6, 7}, {7, 4}, {7, 5}, {7, 6}, {7, 8},
                {8, 4}, {8, 7}, {8, 9}, {8, 10}, {8, 11},
                {9, 8}, {9, 11}, {10, 2}, {10, 4}, {10, 8}, {10, 11},
                {11, 8}, {11, 9}, {11, 10}
        };

        Graph<City> graph = new UnweightedGraph<>(vertices, edges);

        // Create a scene and place it in the stage
        Scene scene = new Scene(new GraphView(graph), 750, 450);
        primaryStage.setTitle("DisplayUSMap"); // Set the stage title
        primaryStage.setScene(scene); // Place the scene in the stage
        primaryStage.show(); // Display the stage
    }

    public static void main(String[] args) {
        Application.launch(args);
    }

    static class City implements Displayable {
        private int x, y;
        private String name;

        City(String name, int x, int y) {
            this.name = name;
            this.x = x;
            this.y = y;
        }

        @Override
        public int getX() {
            return x;
        }

        @Override
        public int getY() {
            return y;
        }

        @Override
        public String getName() {
            return name;
        }
    }
}
クラス City は、座標と名前を使用して頂点をモデル化するために定義されています (行 39 ~ 63)。プログラムは、City タイプの頂点を含むグラフを作成します (行 30)。 City は Displayable を実装しているため、グラフ用に作成された GraphView オブジェクトによってペインにグラフが表示されます (行 33)。
以上がグラフの視覚化の詳細内容です。詳細については、PHP 中国語 Web サイトの他の関連記事を参照してください。