

Python によるコンピューター ビジョンの概要 (パート 1)

注: この投稿では、わかりやすくするためにグレースケール画像のみを使用します。
画像とは何ですか?
画像は値の行列として考えることができ、各値はピクセルの強度を表します。画像形式には主に 3 つのタイプがあります:
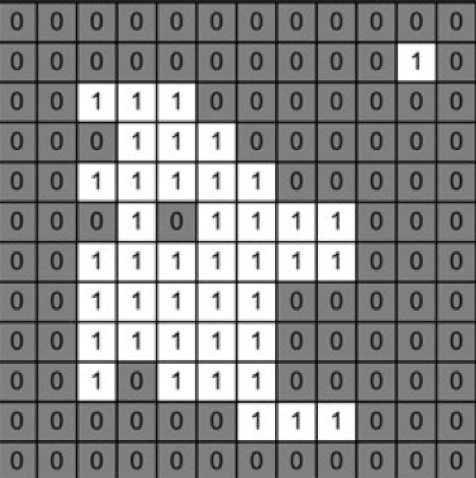
- バイナリ: この形式の画像は、0 (黒) と 1 (白) の値を持つ単一の 2 次元行列で表されます。これは画像表現の最も単純な形式です。
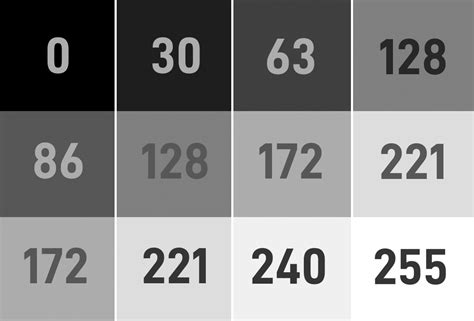
- グレースケール: この形式では、画像は 0 ~ 255 の範囲の値を持つ単一の 2 次元行列で表されます。ここで、0 は黒を表し、255 は白を表します。中間値は、さまざまなグレーの色合いを表します。
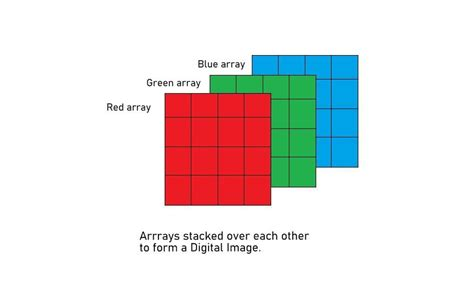
- RGB スケール: ここで、画像は 0 から 255 の範囲の値を持つ 3 つの 2 次元行列 (カラー チャネルごとに 1 つずつ、赤、緑、青) で表されます。各行列には、次のピクセル値が含まれています。 1 つのカラー コンポーネントであり、これら 3 つのチャネルを組み合わせるとフルカラー画像が得られます。
フィルター
フィルターは、特定の操作を適用して画像を変更するために使用されるツールです。フィルターは、画像上を移動するマトリックス (カーネルとも呼ばれます) であり、ウィンドウ内のピクセル値の計算を実行します。平均値フィルターと中央値フィルターという 2 つの一般的なタイプのフィルターについて説明します。
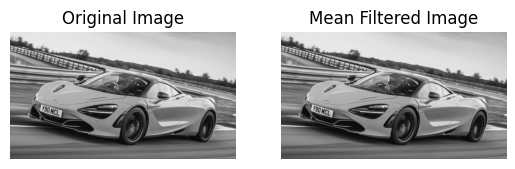
平均フィルター
平均フィルターは、ウィンドウ内のピクセル値を平均化することでノイズを低減するために使用されます。ウィンドウ内の中心ピクセルを、そのウィンドウ内のすべてのピクセル値の平均に置き換えます。 cv2.blur() 関数は、カーネル サイズ 3x3 の平均フィルターを適用します。これは、平均を計算するために各ピクセルの周囲のピクセルの 3x3 ウィンドウを考慮することを意味します。これは画像を滑らかにするのに役立ちます。
import cv2
import matplotlib.pyplot as plt

image = cv2.imread('McLaren-720S-Price-1200x675.jpg', cv2.IMREAD_GRAYSCALE)

# Applies a Mean Filter of size 3 x 3
blurred_image = cv2.blur(image, (3, 3))

plt.subplot(1, 2, 1)
plt.imshow(image, cmap='gray')
plt.title('Original Image')
plt.axis("off")

plt.subplot(1, 2, 2)
plt.imshow(blurred_image, cmap='gray')
plt.title('Mean Filtered Image')
plt.axis("off")
plt.show()
メディアンフィルター
メディアン フィルターは、各ピクセルの値をウィンドウ内のすべてのピクセルの中央値で置き換えることによってノイズを低減するために使用されます。特にごま塩ノイズの除去に効果的です。 cv2.medianBlur() 関数は、カーネル サイズ 3 のメディアン フィルターを適用します。このメソッドは、各ピクセルをその近傍のピクセル値の中央値に置き換えます。これは、ノイズを除去しながらエッジを維持するのに役立ちます。ここで、カーネル サイズが大きいほど、画像はよりぼやけます。
import cv2
import matplotlib.pyplot as plt

image = cv2.imread('McLaren-720S-Price-1200x675.jpg', cv2.IMREAD_GRAYSCALE)

# Applies a Median Filter with a kernel size of 3
blurred_image = cv2.medianBlur(image, 3)

plt.subplot(1, 2, 1)
plt.imshow(image, cmap='gray')
plt.title('Original Image')
plt.axis("off")

plt.subplot(1, 2, 2)
plt.imshow(blurred_image, cmap='gray')
plt.title('Median Filtered Image')
plt.axis("off")
plt.show()

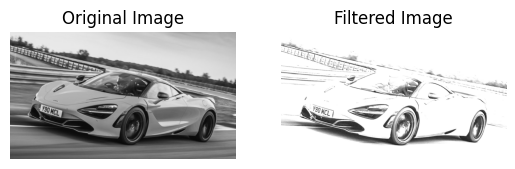
カスタムフィルター
カスタム フィルターを作成して、画像に特定の操作を適用できます。 cv2.filter2D() 関数を使用すると、任意のカスタム カーネルをイメージに適用できます。 cv2.filter2D() 関数は、カスタム カーネル (フィルター) をイメージに適用します。カーネルは、ピクセル値に対して実行される操作を定義する行列です。この例では、カーネルは指定された値に基づいて画像の特定の特徴を強化します。
import cv2
import numpy as np
import matplotlib.pyplot as plt

image = cv2.imread('McLaren-720S-Price-1200x675.jpg', cv2.IMREAD_GRAYSCALE)

# Define a custom filter kernel
kernel = np.array([[2, -1, 5],
                   [-5, 5, -1],
                   [0, -1, 0]])

filtered_image = cv2.filter2D(image, -1, kernel)

plt.subplot(1, 2, 1)
plt.imshow(image, cmap='gray')
plt.title('Original Image')
plt.axis('off')

plt.subplot(1, 2, 2)
plt.imshow(filtered_image, cmap='gray')
plt.title('Filtered Image')
plt.axis('off')

plt.show()
閾値処理
注: コード スニペットでは、しきい値処理されたイメージを割り当てるときに _ , image が表示されます。これは、 cv2.threshold 関数が、使用されたしきい値としきい値処理されたイメージの 2 つの値を返すためです。閾値処理された画像のみが必要なので、_ を使用して閾値を無視します。
閾値処理は、条件に基づいてピクセル値を設定することにより、画像を 2 値画像に変換します。しきい値処理手法にはいくつかの種類があります:
グローバルしきい値
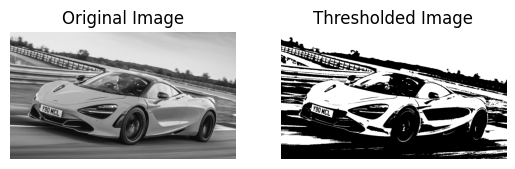
単純なしきい値処理
このメソッドは、画像全体に固定のしきい値を設定します。しきい値を超える値を持つピクセルは最大値 (255) に設定され、それ以下のピクセルは 0 に設定されます。 cv2.threshold() 関数は単純なしきい値処理に使用されます。強度が 127 より大きいピクセルは白 (255) に設定され、強度が 127 以下のピクセルは黒 (0) に設定され、バイナリ イメージが生成されます。
import cv2
import matplotlib.pyplot as plt

image = cv2.imread('McLaren-720S-Price-1200x675.jpg', cv2.IMREAD_GRAYSCALE)

_, thresholded_image = cv2.threshold(image, 127, 255, cv2.THRESH_BINARY)

plt.subplot(1, 2, 1)
plt.imshow(image, cmap='gray')
plt.title('Original Image')
plt.axis("off")

plt.subplot(1, 2, 2)
plt.imshow(thresholded_image, cmap='gray')
plt.title('Thresholded Image')
plt.axis("off")
plt.show()
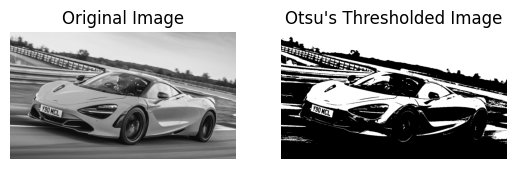
Otsu Thresholding
Otsu's method determines the optimal threshold value automatically based on the histogram of the image. This method minimizes intra-class variance and maximizes inter-class variance. By setting the threshold value to 0 and using cv2.THRESH_OTSU, the function automatically calculates the best threshold value to separate the foreground from the background.
import cv2
import matplotlib.pyplot as plt

image = cv2.imread('McLaren-720S-Price-1200x675.jpg', cv2.IMREAD_GRAYSCALE)

_, otsu_thresholded_image = cv2.threshold(image, 0, 255, cv2.THRESH_BINARY + cv2.THRESH_OTSU)

plt.subplot(1, 2, 1)
plt.imshow(image, cmap='gray')
plt.title('Original Image')
plt.axis("off")

plt.subplot(1, 2, 2)
plt.imshow(otsu_thresholded_image, cmap='gray')
plt.title("Otsu's Thresholded Image")
plt.axis("off")
plt.show()
Adaptive Thresholding
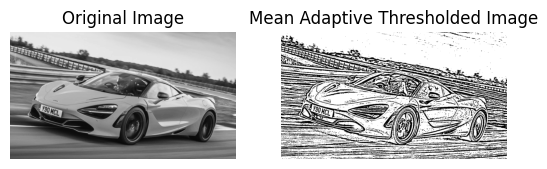
Mean Adaptive Thresholding
In Mean Adaptive Thresholding, the threshold value for each pixel is calculated based on the average of pixel values in a local neighborhood around that pixel. This method adjusts the threshold dynamically across different regions of the image. The cv2.adaptiveThreshold() function calculates the threshold for each pixel based on the mean value of the pixel values in a local 11x11 neighborhood. A constant value of 2 is subtracted from this mean to fine-tune the threshold. This method is effective for images with varying lighting conditions.
import cv2
import matplotlib.pyplot as plt

image = cv2.imread('McLaren-720S-Price-1200x675.jpg', cv2.IMREAD_GRAYSCALE)

mean_adaptive_thresholded_image = cv2.adaptiveThreshold(image, 255, cv2.ADAPTIVE_THRESH_MEAN_C, cv2.THRESH_BINARY, 11, 2)

plt.subplot(1, 2, 1)
plt.imshow(image, cmap='gray')
plt.title('Original Image')
plt.axis("off")

plt.subplot(1, 2, 2)
plt.imshow(mean_adaptive_thresholded_image, cmap='gray')
plt.title('Mean Adaptive Thresholded Image')
plt.axis("off")
plt.show()
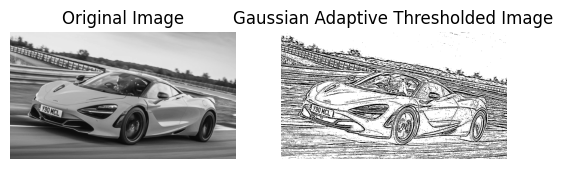
Gaussian Adaptive Thresholding
Gaussian Adaptive Thresholding computes the threshold value for each pixel based on a Gaussian-weighted sum of the pixel values in a local neighborhood. This method often provides better results in cases with non-uniform illumination. In Gaussian Adaptive Thresholding, the threshold is determined by a Gaussian-weighted sum of pixel values in an 11x11 neighborhood. The constant value 2 is subtracted from this weighted mean to adjust the threshold. This method is useful for handling images with varying lighting and shadows.
import cv2
import matplotlib.pyplot as plt

image = cv2.imread('McLaren-720S-Price-1200x675.jpg', cv2.IMREAD_GRAYSCALE)

gaussian_adaptive_thresholded_image = cv2.adaptiveThreshold(image, 255, cv2.ADAPTIVE_THRESH_GAUSSIAN_C, cv2.THRESH_BINARY, 11, 2)

plt.subplot(1, 2, 1)
plt.imshow(image, cmap='gray')
plt.title('Original Image')
plt.axis("off")

plt.subplot(1, 2, 2)
plt.imshow(gaussian_adaptive_thresholded_image, cmap='gray')
plt.title('Gaussian Adaptive Thresholded Image')
plt.axis("off")
plt.show()
References
- Encord.com
- Pyimagesearch.com
- OpenCV Thresholding
- OpenCV Filtering
以上がPython によるコンピューター ビジョンの概要 (パート 1)の詳細内容です。詳細については、PHP 中国語 Web サイトの他の関連記事を参照してください。

ホットAIツール

Undresser.AI Undress
リアルなヌード写真を作成する AI 搭載アプリ

AI Clothes Remover
写真から衣服を削除するオンライン AI ツール。

Undress AI Tool
脱衣画像を無料で

Clothoff.io
AI衣類リムーバー

Video Face Swap
完全無料の AI 顔交換ツールを使用して、あらゆるビデオの顔を簡単に交換できます。

人気の記事
ホットツール

メモ帳++7.3.1
使いやすく無料のコードエディター

SublimeText3 中国語版
中国語版、とても使いやすい

ゼンドスタジオ 13.0.1
強力な PHP 統合開発環境

ドリームウィーバー CS6
ビジュアル Web 開発ツール

SublimeText3 Mac版
神レベルのコード編集ソフト(SublimeText3)
ホットトピック
 1675
1675
 14
1429
52
1333
25
1278
29
1257
24
14
1429
52
1333
25
1278
29
1257
24

 Python vs. C:曲線と使いやすさの学習
Apr 19, 2025 am 12:20 AM
Python vs. C:曲線と使いやすさの学習
Apr 19, 2025 am 12:20 AM
Pythonは学習と使用が簡単ですが、Cはより強力ですが複雑です。 1。Python構文は簡潔で初心者に適しています。動的なタイピングと自動メモリ管理により、使いやすくなりますが、ランタイムエラーを引き起こす可能性があります。 2.Cは、高性能アプリケーションに適した低レベルの制御と高度な機能を提供しますが、学習しきい値が高く、手動メモリとタイプの安全管理が必要です。
 Pythonの学習:2時間の毎日の研究で十分ですか?
Apr 18, 2025 am 12:22 AM
Pythonの学習:2時間の毎日の研究で十分ですか?
Apr 18, 2025 am 12:22 AM
Pythonを1日2時間学ぶだけで十分ですか?それはあなたの目標と学習方法に依存します。 1)明確な学習計画を策定し、2)適切な学習リソースと方法を選択します。3)実践的な実践とレビューとレビューと統合を練習および統合し、統合すると、この期間中にPythonの基本的な知識と高度な機能を徐々に習得できます。
 Python vs. C:パフォーマンスと効率の探索
Apr 18, 2025 am 12:20 AM
Python vs. C:パフォーマンスと効率の探索
Apr 18, 2025 am 12:20 AM
Pythonは開発効率でCよりも優れていますが、Cは実行パフォーマンスが高くなっています。 1。Pythonの簡潔な構文とリッチライブラリは、開発効率を向上させます。 2.Cのコンピレーションタイプの特性とハードウェア制御により、実行パフォーマンスが向上します。選択を行うときは、プロジェクトのニーズに基づいて開発速度と実行効率を比較検討する必要があります。
 Python vs. C:重要な違いを理解します
Apr 21, 2025 am 12:18 AM
Python vs. C:重要な違いを理解します
Apr 21, 2025 am 12:18 AM
PythonとCにはそれぞれ独自の利点があり、選択はプロジェクトの要件に基づいている必要があります。 1)Pythonは、簡潔な構文と動的タイピングのため、迅速な開発とデータ処理に適しています。 2)Cは、静的なタイピングと手動メモリ管理により、高性能およびシステムプログラミングに適しています。
 Python Standard Libraryの一部はどれですか:リストまたは配列はどれですか?
Apr 27, 2025 am 12:03 AM
Python Standard Libraryの一部はどれですか:リストまたは配列はどれですか?
Apr 27, 2025 am 12:03 AM
PythonListSarePartOfThestAndardarenot.liestareBuilting-in、versatile、forStoringCollectionsのpythonlistarepart。
 Python:自動化、スクリプト、およびタスク管理
Apr 16, 2025 am 12:14 AM
Python:自動化、スクリプト、およびタスク管理
Apr 16, 2025 am 12:14 AM
Pythonは、自動化、スクリプト、およびタスク管理に優れています。 1)自動化:OSやShutilなどの標準ライブラリを介してファイルバックアップが実現されます。 2)スクリプトの書き込み:Psutilライブラリを使用してシステムリソースを監視します。 3)タスク管理:スケジュールライブラリを使用してタスクをスケジュールします。 Pythonの使いやすさと豊富なライブラリサポートにより、これらの分野で優先ツールになります。
 科学コンピューティングのためのPython:詳細な外観
Apr 19, 2025 am 12:15 AM
科学コンピューティングのためのPython:詳細な外観
Apr 19, 2025 am 12:15 AM
科学コンピューティングにおけるPythonのアプリケーションには、データ分析、機械学習、数値シミュレーション、視覚化が含まれます。 1.numpyは、効率的な多次元配列と数学的関数を提供します。 2。ScipyはNumpy機能を拡張し、最適化と線形代数ツールを提供します。 3. Pandasは、データ処理と分析に使用されます。 4.matplotlibは、さまざまなグラフと視覚的な結果を生成するために使用されます。
 Web開発用のPython:主要なアプリケーション
Apr 18, 2025 am 12:20 AM
Web開発用のPython:主要なアプリケーション
Apr 18, 2025 am 12:20 AM
Web開発におけるPythonの主要なアプリケーションには、DjangoおよびFlaskフレームワークの使用、API開発、データ分析と視覚化、機械学習とAI、およびパフォーマンスの最適化が含まれます。 1。DjangoandFlask Framework:Djangoは、複雑な用途の迅速な発展に適しており、Flaskは小規模または高度にカスタマイズされたプロジェクトに適しています。 2。API開発:フラスコまたはdjangorestFrameworkを使用して、Restfulapiを構築します。 3。データ分析と視覚化:Pythonを使用してデータを処理し、Webインターフェイスを介して表示します。 4。機械学習とAI:Pythonは、インテリジェントWebアプリケーションを構築するために使用されます。 5。パフォーマンスの最適化:非同期プログラミング、キャッシュ、コードを通じて最適化
