タスク-Python パッケージ
少数の Python パッケージ
進行状況バーと TQDM:
ループ、ファイル処理、ダウンロードなどのタスクの進行状況バーを実装します。
from progress.bar import ChargingBar
bar = ChargingBar('Processing', max=20)
for i in range(20):
    # Do some work
    bar.next()
bar.finish()
出力:
Processing ████████████████████████████████ 100%
TQDM: プログレス バーに似ていますが、プログレス バーよりも設定が簡単です。
from tqdm import tqdm
import time

for i in tqdm(range(100)):
    time.sleep(0.1)
出力:
100%|██████████████████████████████████████| 100/100 [00:00<00:00, 18784.11it/s]
Matplotlib:
Matplotlib は、静的、アニメーション、インタラクティブなビジュアライゼーションの作成に使用されます。
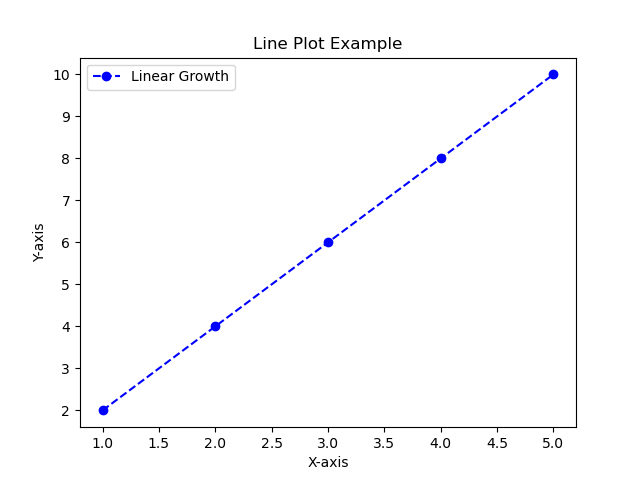
import matplotlib.pyplot as plt

x = [1, 2, 3, 4, 5]
y = [2, 4, 6, 8, 10]

plt.plot(x, y, label='Linear Growth', color='blue', linestyle='--', marker='o')
plt.title("Line Plot Example")
plt.xlabel("X-axis")
plt.ylabel("Y-axis")
plt.legend()
plt.show()
出力:

ナンピー:
NumPy (数値 Python) は、数値計算用の基本的な Python ライブラリです。これは、大規模な多次元配列 (1 次元、2 次元、3 次元など) と行列の操作のサポートと、これらの配列を効率的に操作するための数学関数のコレクションを提供します。
例:
import numpy as np

# 1D array
arr1 = np.array([1, 2, 3, 4])

# 2D array
arr2 = np.array([[1, 2], [3, 4]])

print(arr1, arr2)
出力:
[1 2 3 4] [[1 2]
 [3 4]]
パンダ:
Series(リスト)とDataFrame(テーブルまたはスプレッドシート)によるデータ操作と分析に使用されます。
例:
import pandas
x=[1,2,3]
y=pandas.Series(x,index=["no1","no2","no3"])
print(y)
出力:
no1    1
no2    2
no3    3
dtype: int64
以上がタスク-Python パッケージの詳細内容です。詳細については、PHP 中国語 Web サイトの他の関連記事を参照してください。

ホットAIツール

Undresser.AI Undress
リアルなヌード写真を作成する AI 搭載アプリ

AI Clothes Remover
写真から衣服を削除するオンライン AI ツール。

Undress AI Tool
脱衣画像を無料で

Clothoff.io
AI衣類リムーバー

Video Face Swap
完全無料の AI 顔交換ツールを使用して、あらゆるビデオの顔を簡単に交換できます。

人気の記事

ホットツール

メモ帳++7.3.1
使いやすく無料のコードエディター

SublimeText3 中国語版
中国語版、とても使いやすい

ゼンドスタジオ 13.0.1
強力な PHP 統合開発環境

ドリームウィーバー CS6
ビジュアル Web 開発ツール

SublimeText3 Mac版
神レベルのコード編集ソフト(SublimeText3)

ホットトピック
 1663
1663
 14
14
 1420
1420
 52
52
 1313
1313
 25
25
 1266
1266
 29
29
 1239
1239
 24
24
 Python vs. C:比較されたアプリケーションとユースケース
Apr 12, 2025 am 12:01 AM
Pythonは、データサイエンス、Web開発、自動化タスクに適していますが、Cはシステムプログラミング、ゲーム開発、組み込みシステムに適しています。 Pythonは、そのシンプルさと強力なエコシステムで知られていますが、Cは高性能および基礎となる制御機能で知られています。
 2時間のPython計画:現実的なアプローチ
Apr 11, 2025 am 12:04 AM
2時間以内にPythonの基本的なプログラミングの概念とスキルを学ぶことができます。 1.変数とデータ型、2。マスターコントロールフロー(条件付きステートメントとループ)、3。機能の定義と使用を理解する4。
 Python:ゲーム、GUIなど
Apr 13, 2025 am 12:14 AM
PythonはゲームとGUI開発に優れています。 1)ゲーム開発は、2Dゲームの作成に適した図面、オーディオ、その他の機能を提供し、Pygameを使用します。 2)GUI開発は、TKINTERまたはPYQTを選択できます。 TKINTERはシンプルで使いやすく、PYQTは豊富な機能を備えており、専門能力開発に適しています。
 2時間でどのくらいのPythonを学ぶことができますか?
Apr 09, 2025 pm 04:33 PM
2時間以内にPythonの基本を学ぶことができます。 1。変数とデータ型を学習します。2。ステートメントやループの場合などのマスター制御構造、3。関数の定義と使用を理解します。これらは、簡単なPythonプログラムの作成を開始するのに役立ちます。
 Python vs. C:曲線と使いやすさの学習
Apr 19, 2025 am 12:20 AM
Pythonは学習と使用が簡単ですが、Cはより強力ですが複雑です。 1。Python構文は簡潔で初心者に適しています。動的なタイピングと自動メモリ管理により、使いやすくなりますが、ランタイムエラーを引き起こす可能性があります。 2.Cは、高性能アプリケーションに適した低レベルの制御と高度な機能を提供しますが、学習しきい値が高く、手動メモリとタイプの安全管理が必要です。
 Pythonと時間:勉強時間を最大限に活用する
Apr 14, 2025 am 12:02 AM
限られた時間でPythonの学習効率を最大化するには、PythonのDateTime、時間、およびスケジュールモジュールを使用できます。 1. DateTimeモジュールは、学習時間を記録および計画するために使用されます。 2。時間モジュールは、勉強と休息の時間を設定するのに役立ちます。 3.スケジュールモジュールは、毎週の学習タスクを自動的に配置します。
 Python:主要なアプリケーションの調査
Apr 10, 2025 am 09:41 AM
Pythonは、Web開発、データサイエンス、機械学習、自動化、スクリプトの分野で広く使用されています。 1)Web開発では、DjangoおよびFlask Frameworksが開発プロセスを簡素化します。 2)データサイエンスと機械学習の分野では、Numpy、Pandas、Scikit-Learn、Tensorflowライブラリが強力なサポートを提供します。 3)自動化とスクリプトの観点から、Pythonは自動テストやシステム管理などのタスクに適しています。
 Python:自動化、スクリプト、およびタスク管理
Apr 16, 2025 am 12:14 AM
Pythonは、自動化、スクリプト、およびタスク管理に優れています。 1)自動化:OSやShutilなどの標準ライブラリを介してファイルバックアップが実現されます。 2)スクリプトの書き込み:Psutilライブラリを使用してシステムリソースを監視します。 3)タスク管理:スケジュールライブラリを使用してタスクをスケジュールします。 Pythonの使いやすさと豊富なライブラリサポートにより、これらの分野で優先ツールになります。


