

グループの行と集約値へのExcelグループ機能

Unlock the Power of Excel's GROUPBY Function for Enhanced Data Analysis! This function simplifies data grouping, summarization, sorting, and filtering, all within a single formula. Say goodbye to complex outlines, subtotals, and pivot tables – GROUPBY streamlines your workflow.
Excel's data analysis capabilities just got a significant boost. While features like outlines and pivot tables have long been staples for organizing and interpreting data, the new GROUPBY function offers a more streamlined approach, all within the convenience of your formula bar.
- Understanding the Excel GROUPBY Function: Syntax and Basic Applications
- GROUPBY Function Availability and Compatibility
- Constructing a Basic GROUPBY Formula
- Mastering GROUPBY: Advanced Formula Examples
- Selecting the Right Aggregation Function
- Displaying Headers Effectively
- Grouping Rows Using Multiple Columns
- Grouping with Non-Adjacent Columns
- Controlling the Display of Totals and Subtotals
- Sorting Grouped Data
- Filtering Results
- Aggregating Multiple Columns (Adjacent and Non-Adjacent)
- Multiple Aggregations on a Single Dataset
- Handling Comma-Separated Text Strings
- Auto-Formatting GROUPBY Results with Conditional Formatting
- Troubleshooting GROUPBY Function Issues
The Excel GROUPBY Function
The GROUPBY function efficiently groups and aggregates data rows based on values in one or more columns. It also supports sorting and filtering of grouped data. As a dynamic array function, it returns multiple results, spilling into adjacent cells. The output resembles a pivot table without the formatting; the spill range dynamically recalculates with data changes. This is particularly beneficial for large datasets requiring summarized data through functions like SUM, AVERAGE, or COUNT.

Note: GROUPBY is similar to PIVOTBY, but GROUPBY exclusively groups data in rows.
Function Syntax
GROUPBY(row_fields, values, function, [field_headers], [total_depth], [sort_order], [filter_array])
Seven arguments are available, but only the first three are mandatory:
-
row_fields(required): The range of values to group by. -
values(required): The values to aggregate. -
function(required): The aggregation function (e.g.,SUM,AVERAGE,COUNT,MIN,MAX). -
field_headers(optional): Controls header display (0: No headers, 1: Yes, but don't show, 2: No headers, but generate, 3: Yes, and show). -
total_depth(optional): Controls total/subtotal display (0: No totals, 1: Grand total at bottom, 2: Grand and subtotals at bottom, -1: Grand total at top, -2: Grand and subtotals at top). -
sort_order(optional): Sorts by column index (positive for ascending, negative for descending). Arrays allow multi-column sorting. -
filter_array(optional): Filters rows using a Boolean array.
Usage Tips
- Dynamic Updates: The formula dynamically adjusts to dataset changes within its range. Adding new rows requires including them in the argument ranges or using an Excel table for automatic expansion.
-
Header Detection: If
field_headersis omitted, Excel infers headers based on thevaluesargument (text followed by a number suggests headers). -
Range Consistency:
row_fieldsandvaluesmust have equal lengths to avoid#VALUE!errors. - Conditional Formatting: Enhance readability by using conditional formatting to highlight totals and subtotals.
Note: GROUPBY is under development; thorough testing is recommended.
GROUPBY Function Availability
Currently available in Excel for Microsoft 365 (Insider Beta Channel).
Basic GROUPBY Formula
Let's assume a dataset with project names (Column A), types (Column B), and revenues (Column C). To summarize revenues by project type:
=GROUPBY(B2:B32, C2:C32, SUM)
This yields a list of unique project types with their revenue sums. Defaults are used for optional arguments (no headers, ascending sort, grand total at bottom).

Advanced GROUPBY Formula Examples
This section expands on the basic example, demonstrating the function's versatility.
Choosing the Aggregation Function
GROUPBY supports 16 aggregation functions, including standard functions (SUM, AVERAGE, COUNT, etc.) and specialized ones (PERCENTOF, ARRAYTOTEXT). These are eta-reduced lambdas, simplifying usage. Custom lambda functions are also supported. Multiple aggregations are possible using vectors (vertical for column stacking, horizontal for row stacking).
Displaying Headers
Use the field_headers argument (set to 3) to include headers in the output.
=GROUPBY(B2:B32, C2:C32, SUM, 3)

Grouping by Multiple Columns
Include a multi-column range in row_fields to group by multiple columns. For example, grouping by project type and status:
=GROUPBY(B2:C32, D2:D32, COUNT)

Grouping by Non-Adjacent Columns
Use CHOOSECOLS to select non-adjacent columns for grouping:
=GROUPBY(CHOOSECOLS(A2:D32, 2, 4), C2:C32, COUNT)

Controlling Totals and Subtotals
Use total_depth to control total/subtotal display. Setting it to 2 shows both grand and subtotals.
=GROUPBY(B2:C32, D2:D32, SUM, 3, 2)

Sorting Grouped Rows
Use sort_order for custom sorting (positive for ascending, negative for descending). Arrays enable multi-column sorting.
=GROUPBY(B2:B32, C2:C32, SUM, , , 2) (Sorts by values)

=GROUPBY(B2:C32, D2:D32, SUM, , , {-1,2}) (Multi-column sort)

Filtering Results
Use filter_array (Boolean array) to filter rows.
=GROUPBY(B2:B32, C2:C32, SUM, , , , B2:B32<>"Design")

Aggregating Multiple Columns
Aggregate adjacent columns directly:
=GROUPBY(B2:B32, D2:E32, AVERAGE, 3)

For non-adjacent columns, use CHOOSECOLS:
=GROUPBY(B2:B32, CHOOSECOLS(C2:E32, 1, 3), AVERAGE, 3)

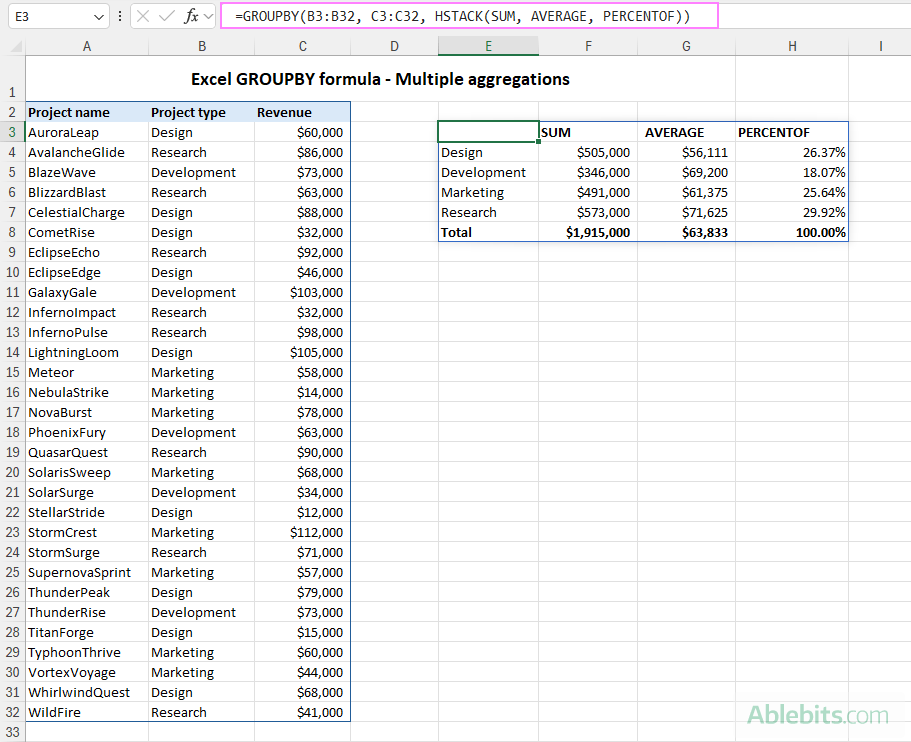
Multiple Aggregations on the Same Data
Use HSTACK or VSTACK for multiple aggregations:
=GROUPBY(B3:B32, C3:C32, HSTACK(SUM, AVERAGE, PERCENTOF))
=GROUPBY(B3:B32, C3:C32, VSTACK(SUM, AVERAGE, MIN, MAX),, 0)

Grouping Comma-Separated Text Values
Use ARRAYTOTEXT to group comma-separated text:
=GROUPBY(B3:B23, A3:A23, ARRAYTOTEXT, 0, 0)

Conditional Formatting of GROUPBY Results
Enhance visual clarity using conditional formatting to highlight headers, totals, and subtotals.
Troubleshooting GROUPBY Function Issues
- Function Unavailability: Ensure you have a Microsoft 365 subscription and the latest updates.
-
#VALUE!Error: Check for equal lengths inrow_fieldsandvaluesarguments, and ensure correctfilter_arraylength. Also, verify thattotal_depthis appropriate for the number of columns inrow_fields. -
#SPILL!Error: Clear adjacent cells to allow spill range.
In conclusion, the GROUPBY function significantly enhances Excel's data analysis capabilities, providing a powerful and efficient tool for various data manipulation tasks. With practice, you'll unlock its full potential for insightful data analysis.
以上がグループの行と集約値へのExcelグループ機能の詳細内容です。詳細については、PHP 中国語 Web サイトの他の関連記事を参照してください。

ホットAIツール

Undresser.AI Undress
リアルなヌード写真を作成する AI 搭載アプリ

AI Clothes Remover
写真から衣服を削除するオンライン AI ツール。

Undress AI Tool
脱衣画像を無料で

Clothoff.io
AI衣類リムーバー

Video Face Swap
完全無料の AI 顔交換ツールを使用して、あらゆるビデオの顔を簡単に交換できます。

人気の記事
ホットツール

メモ帳++7.3.1
使いやすく無料のコードエディター

SublimeText3 中国語版
中国語版、とても使いやすい

ゼンドスタジオ 13.0.1
強力な PHP 統合開発環境

ドリームウィーバー CS6
ビジュアル Web 開発ツール

SublimeText3 Mac版
神レベルのコード編集ソフト(SublimeText3)
ホットトピック
 7790
7790
 15
1644
14
1401
52
1298
25
1234
29
15
1644
14
1401
52
1298
25
1234
29

 列または行の上位3、5、10値を見つけるためのExcel式
Apr 01, 2025 am 05:09 AM
列または行の上位3、5、10値を見つけるためのExcel式
Apr 01, 2025 am 05:09 AM
このチュートリアルでは、データセット内の上部N値を効率的に見つけ、Excel式を使用して関連データを取得する方法を示しています。 最高、最低、または特定の基準を満たすものを必要とするかどうかにかかわらず、このガイドは解決策を提供します。 findi
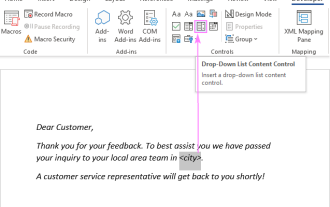 Outlookメールテンプレートにドロップダウンリストを追加します
Apr 01, 2025 am 05:13 AM
Outlookメールテンプレートにドロップダウンリストを追加します
Apr 01, 2025 am 05:13 AM
このチュートリアルでは、複数の選択やデータベースの母集団を含むOutlookメールテンプレートにドロップダウンリストを追加する方法を示します。 Outlookはドロップダウンを直接サポートしていませんが、このガイドは創造的な回避策を提供します。 メールテンプレートを保存します
 Flash Fill In Excelを使用する方法例
Apr 05, 2025 am 09:15 AM
Flash Fill In Excelを使用する方法例
Apr 05, 2025 am 09:15 AM
このチュートリアルは、データ入力タスクを自動化するための強力なツールであるExcelのFlash Fill機能の包括的なガイドを提供します。 定義と場所から高度な使用やトラブルシューティングまで、さまざまな側面をカバーしています。 ExcelのFLAを理解する
 Outlookにカレンダーを追加する方法:共有、インターネットカレンダー、ICALファイル
Apr 03, 2025 am 09:06 AM
Outlookにカレンダーを追加する方法:共有、インターネットカレンダー、ICALファイル
Apr 03, 2025 am 09:06 AM
この記事では、IcalEndarファイルのインポートなど、Outlookデスクトップアプリケーション内で共有カレンダーにアクセスして利用する方法について説明します。 以前は、Outlookカレンダーの共有について説明しました。 それでは、共有されているカレンダーの表示方法を調べてみましょう
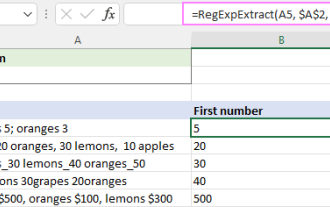 Excelで文字列を抽出するための正規表現(1つまたはすべての一致)
Mar 28, 2025 pm 12:19 PM
Excelで文字列を抽出するための正規表現(1つまたはすべての一致)
Mar 28, 2025 pm 12:19 PM
このチュートリアルでは、Excelで正規表現を使用して、特定のパターンに一致するサブストリングを見つけて抽出する方法を学びます。 Microsoft Excelは、セルからテキストを抽出するための多くの機能を提供します。これらの関数はほとんどに対処できます
 Excelの式の中央値 - 実用的な例
Apr 11, 2025 pm 12:08 PM
Excelの式の中央値 - 実用的な例
Apr 11, 2025 pm 12:08 PM
このチュートリアルでは、中央値関数を使用してExcelの数値データの中央値を計算する方法について説明します。 中央傾向の重要な尺度である中央値は、データセットの中央値を識別し、中央の傾向のより堅牢な表現を提供します
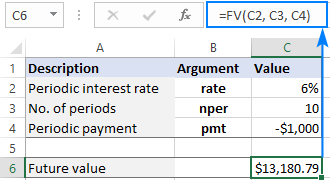 将来の値を計算するためのExcelのFV機能
Apr 01, 2025 am 04:57 AM
将来の値を計算するためのExcelのFV機能
Apr 01, 2025 am 04:57 AM
このチュートリアルでは、ExcelのFV機能を使用して投資の将来の価値を決定する方法について説明します。 効果的な財務計画は、投資の成長を理解することにかかっています。
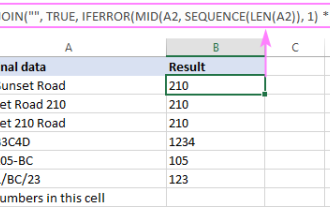 Excelセルでテキストと数字を削除 /分割する方法
Apr 01, 2025 am 05:07 AM
Excelセルでテキストと数字を削除 /分割する方法
Apr 01, 2025 am 05:07 AM
このチュートリアルでは、Excelセル内のテキストと数値を分離するためのいくつかの方法を示しており、組み込み関数とカスタムVBA関数の両方を利用しています。 テキストを削除しながら数値を抽出する方法を学び、数字を破棄しながらテキストを分離します
