

純粋な JAVASCRIPT チャート アニメーション プラグイン Highcharts Examples_jquery

Highcharts is a charting library written in pure JavaScript, offering an easy way of adding interactive charts to your web site or web application. Highcharts currently supports line, spline, area, areaspline, column, bar, pie and scatter chart types.
Features

It works in all modern browsers including the iPhone/iPad and Internet Explorer from version 6. Standard browsers use SVG for the graphics rendering. In Internet Explorer graphics are drawn using VML.

.
Highcharts is solely based on native browser technologies and doesn't require client side plugins like Flash or Java. Furthermore you don't need to install anything on your server. No PHP or ASP.NET. Highcharts needs only two JS files to run: The highcharts.js core and either the jQuery or the MooTools framework. One of these frameworks is most likely already in use in your web page.
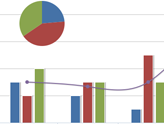
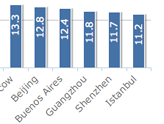
Highcharts supports line, spline, area, areaspline, column, bar, pie and scatter chart types. Any of these can be combined in one chart.
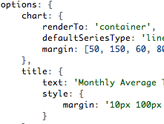
Setting the Highcharts configuration options requires no special programming skills. The options are given in a JavaScript object notation structure, which is basically a set of keys and values connected by colons, separated by commas and grouped by curly brackets.
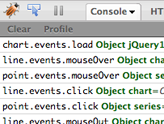
Through a full API you can add, remove and modify series, axes or points at any time after chart creation. Numerous events supply hooks for programming agains the chart. In combination with jQuery's or MooTools' Ajax API, this opens for solutions like live charts constantly updating with values from the server, user supplied data and more.
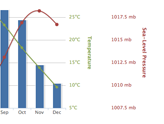
Sometimes you want to compare variables that are not the same scale - for example temperature versus rainfall and air pressure. Highcharts lets you assign an y axis for each series - or an x axis if you want to compare data sets of different categories. Each axis can be placed to the right or left, top or bottom of the chart. All options can be set individually, including reversing, styling and position.
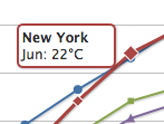
On hovering the chart Highcharts can display a tooltip text with information on each point and series. The tooltip follows as the user moves the mouse over the graph, and great efforts have been taken to make it stick to the nearest point as well as making it easy to read a point that is below another point.
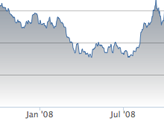
75% of all charts with an X and Y axis have a date-time X axis. Therefore Highchart is very intelligent about time values. With milliseconds axis units, Highcharts determines where to place the ticks so that they always mark the start of the month or the week, midnight and midday, the full hour etc.
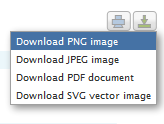
With the exporting module enabled, your users can export the chart to PNG, JPG, PDF or SVG format at the click of a button, or print the chart directly from the web page.
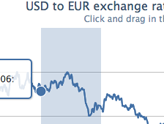
By zooming in on a chart you can examine an especially interesting part of the data more closely. Zooming can be in the X or Y dimension, or both.

Highcharts は JavaScript 配列でデータを取得します。この配列は、ローカル構成オブジェクト、別のファイル、または別のサイトで定義できます。 さらに、データは任意の形式でハイチャートに処理でき、データを配列に解析するためにコールバック関数が使用されます。
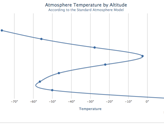
棒グラフなど、グラフを裏返して X 軸を垂直に見せる必要がある場合があります。 最高値が原点に最も近いように表示される軸の反転もサポートされています。
個人のウェブサイト、学校のサイト、または非営利組織にハイチャートを使用したいですか? その場合、作成者の許可は必要なく、そのままハイチャートを使用してください。 商用ウェブサイトとプロジェクトについては、

ホットAIツール

Undresser.AI Undress
リアルなヌード写真を作成する AI 搭載アプリ

AI Clothes Remover
写真から衣服を削除するオンライン AI ツール。

Undress AI Tool
脱衣画像を無料で

Clothoff.io
AI衣類リムーバー

Video Face Swap
完全無料の AI 顔交換ツールを使用して、あらゆるビデオの顔を簡単に交換できます。

人気の記事
ホットツール

メモ帳++7.3.1
使いやすく無料のコードエディター

SublimeText3 中国語版
中国語版、とても使いやすい

ゼンドスタジオ 13.0.1
強力な PHP 統合開発環境

ドリームウィーバー CS6
ビジュアル Web 開発ツール

SublimeText3 Mac版
神レベルのコード編集ソフト(SublimeText3)
ホットトピック
 7628
7628
 15
1389
52
89
11
31
141
15
1389
52
89
11
31
141

 Googleスプレッドシートの凡例にラベルを追加する方法
Feb 19, 2024 am 11:03 AM
Googleスプレッドシートの凡例にラベルを追加する方法
Feb 19, 2024 am 11:03 AM
この記事では、Google スプレッドシートの凡例に、名前や ID を提供する 1 つの事柄に焦点を当てたラベルを追加する方法を説明します。凡例はシステムまたは物事のグループを説明し、関連するコンテキスト情報を提供します。 GoogleSheet の凡例にラベルを追加する方法 グラフを操作するときに、グラフを理解しやすくしたい場合があります。これは、適切なラベルと凡例を追加することで実現できます。次に、Google スプレッドシートの凡例にラベルを追加してデータをわかりやすくする方法を説明します。チャートを作成します。 凡例ラベルのテキストを編集します。 始めましょう。 1] グラフを作成する 凡例にラベルを付けるには、まずグラフを作成する必要があります。 まず、GoogleSheets の列または行に入力します。
 サンキー チャートを使用してハイチャートにデータを表示する方法
Dec 17, 2023 pm 04:41 PM
サンキー チャートを使用してハイチャートにデータを表示する方法
Dec 17, 2023 pm 04:41 PM
サンキー ダイアグラムを使用してハイチャートにデータを表示する方法 サンキー ダイアグラム (SankeyDiagram) は、フロー、エネルギー、資金などの複雑なプロセスを視覚化するために使用されるチャート タイプです。さまざまなノード間の関係とフローを明確に表示できるため、データの理解と分析が容易になります。この記事では、Highcharts を使用して Sankey チャートを作成およびカスタマイズする方法を、具体的なコード例とともに紹介します。まず、Highcharts ライブラリと Sank をロードする必要があります。
 PHP 配列を使用してチャートや統計グラフを生成および表示する方法
Jul 15, 2023 pm 12:24 PM
PHP 配列を使用してチャートや統計グラフを生成および表示する方法
Jul 15, 2023 pm 12:24 PM
PHP 配列を使用してチャートや統計グラフを生成および表示する方法 PHP は、強力なデータ処理機能とグラフィック生成機能を備えた、広く使用されているサーバーサイド スクリプト言語です。 Web 開発では、データのグラフや統計グラフを表示する必要がよくありますが、PHP 配列を使用すると、これらの機能を簡単に実装できます。この記事では、PHP 配列を使用してチャートや統計グラフを生成および表示する方法を紹介し、関連するコード例を示します。必要なライブラリ ファイルとスタイル シートの導入 開始する前に、いくつかの必要なライブラリ ファイルを PHP ファイルに導入する必要があります
 ハイチャートで動的データを使用してリアルタイム データを表示する方法
Dec 17, 2023 pm 06:57 PM
ハイチャートで動的データを使用してリアルタイム データを表示する方法
Dec 17, 2023 pm 06:57 PM
ハイチャートで動的データを使用してリアルタイム データを表示する方法 ビッグ データ時代の到来により、リアルタイム データの表示がますます重要になってきました。 Highcharts は人気のあるグラフ作成ライブラリとして、豊富な機能とカスタマイズ性を提供し、リアルタイム データを柔軟に表示できます。この記事では、ハイチャートで動的データを使用してリアルタイム データを表示する方法と、具体的なコード例を紹介します。まず、リアルタイム データを提供できるデータ ソースを準備する必要があります。この記事では、私は
 Vue 統計グラフでの線形グラフ関数と円グラフ関数の実装
Aug 19, 2023 pm 06:13 PM
Vue 統計グラフでの線形グラフ関数と円グラフ関数の実装
Aug 19, 2023 pm 06:13 PM
Vue 統計グラフの線形グラフおよび円グラフ機能は、データ分析および視覚化の分野で実装されており、統計グラフは非常に一般的に使用されるツールです。人気の JavaScript フレームワークである Vue は、統計グラフの表示や対話など、さまざまな機能を実装するための便利なメソッドを提供します。この記事では、Vue を使用して線形グラフ関数と円グラフ関数を実装する方法を紹介し、対応するコード例を示します。線グラフ関数の実装 線グラフは、データの傾向や変化を表示するために使用されるグラフの一種です。 Vue では、いくつかの優れた機能を使用できます。
 ハイチャートを使用してガント チャートを作成する方法
Dec 17, 2023 pm 07:23 PM
ハイチャートを使用してガント チャートを作成する方法
Dec 17, 2023 pm 07:23 PM
Highcharts を使用してガント チャートを作成する方法には、特定のコード サンプルが必要です。はじめに: ガント チャートは、プロジェクトの進捗状況や時間管理を表示するためによく使用されるチャート形式です。タスクの開始時刻、終了時刻、進捗状況を視覚的に表示できます。 Highcharts は、豊富なチャート タイプと柔軟な構成オプションを提供する強力な JavaScript チャート ライブラリです。この記事では、Highcharts を使用してガント チャートを作成する方法と具体的なコード例を紹介します。 1. ハイチャート
 積み上げチャートを使用してハイチャートにデータを表示する方法
Dec 18, 2023 pm 05:56 PM
積み上げチャートを使用してハイチャートにデータを表示する方法
Dec 18, 2023 pm 05:56 PM
積み上げチャートを使用してハイチャートにデータを表示する方法 積み上げチャートはデータを視覚化する一般的な方法で、複数のデータ系列の合計を同時に表示し、各データ系列の寄与を棒グラフの形式で表示できます。 Highcharts は、さまざまなデータ視覚化のニーズを満たすための豊富な種類のグラフと柔軟な構成オプションを提供する強力な JavaScript ライブラリです。この記事では、Highcharts を使用して積み上げグラフを作成し、提供する方法を紹介します。
 Vue フレームワークで統計グラフ システムを迅速に構築する方法
Aug 21, 2023 pm 05:48 PM
Vue フレームワークで統計グラフ システムを迅速に構築する方法
Aug 21, 2023 pm 05:48 PM
Vue フレームワークで統計グラフ システムを迅速に構築する方法 最新の Web アプリケーションでは、統計グラフは不可欠なコンポーネントです。人気のあるフロントエンド フレームワークとして、Vue.js は、統計グラフ システムを迅速に構築するのに役立つ便利なツールとコンポーネントを多数提供します。この記事では、Vue フレームワークといくつかのプラグインを使用して、簡単な統計グラフ システムを構築する方法を紹介します。まず、Vue スキャフォールディングといくつかの関連プラグインのインストールなど、Vue.js 開発環境を準備する必要があります。コマンドラインで次のコマンドを実行します
