
この記事では、echart の導入を中心に紹介します。編集者がとても良いと思ったので、参考にさせていただきます。エディターをフォローして見てみましょう
1. プラグインのダウンロード
以下は ECharts のダウンロード リンクです。もちろん、ECharts は ZRender と呼ばれる別のプラグインにも依存していることに注意してください。ほとんどのチャートでは ZRender は必要ありませんが、マップ コントロールやその他の複雑なレンダリング コントロールには ZRender が必要です。不要な問題を避けるために、ECharts をダウンロードするときに ZRender もダウンロードすることをお勧めします。
ECharts ダウンロード アドレス: http://echarts.baidu.com/
ZRender ダウンロード アドレス: http://ecomfe.github.io/zrender/index.html
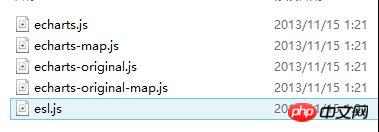
ダウンロード後、それぞれのファイル ディレクトリを解凍します構造は次のとおりです:
ECharts:

ZRender:

2. プラグインリファレンス
まず、新しい Web アプリケーションを作成し、ダウンロードしたファイルの具体的なディレクトリ構造は次のとおりです:

以下の点を説明します:
ECharts に関連するすべてのファイルはすべて echarts フォルダーにあります
echarts フォルダーは 2 つの部分に分かれています
1) 1 つの部分は、echarts で始まる js ファイルです。これらのファイルはすべて、1. の ECharts ファイル ディレクトリ内の js フォルダー内のファイルから取得されます。 1. js の下のファイルの図のボックス。以下の通り:
2) 他の部分は zrender という名前のフォルダーです。ここで特に注意が必要なのは、echarts の js ファイル内の zrender への参照はすべて zrender で始まるためです。ルート ディレクトリ、zrender フォルダーの内容は、次のように、1. の zrender ファイル ディレクトリ内の src フォルダーの内容です。上記の手順を設定した後、ページ上で参照できるようになります。マップの参照は他の基本的なグラフィックの参照とは異なるため、ここでは主にマップ コントロールの使用方法を説明します。他のグラフィックスのプレゼンテーションも簡単に説明します。
MapChart
まず、2 の echarts フォルダーと同じディレクトリ (つまり、Modules フォルダー) に aspx ページまたは HTML ページを追加します。aspx ページで echarts を使用する場合は、レンダリングされる p は、form タグの外側に配置する必要があります。そうしないと、グラフィックスが表示されません。
次のように head タグに echarts への参照を追加します。
<head runat="server">
  <title></title>
  <script src="echarts/esl.js" type="text/javascript"></script>
</head>
body タグの form タグの外側に、チャートのレンダリングのコンテナとして使用される p を追加します。以下のように:
<body>

<p id="main"style="height:500px;border:1px solid #ccc;padding:10px;"></p>

……………

……………

</body>
<script type="text/javascript">
//为模块加载器配置echarts的路径,这里主要是配置map图表的路径,其他的图表跟map的配置还不太一样,下边也会做另一种类型的图表事例。
这里引用的主要是echarts文件夹下的echarts-map文件,而其他类型的图表引用的都是echarts文件夹下的echarts文件。
require.config({
paths: {
echarts:'./echarts/echarts',
'echarts/chart/map':'./echarts/echarts-map'
}
});
//动态加载echarts,在回掉函数中使用,要注意保持按需加载结构定义图表路径
require(
[
'echarts',
'echarts/chart/map'
],
function (ec) {
varmyChart=ecinit(documentgetElementById('main'));
//option主要是图标的一些设置,这不是这篇文章的重点,关于具体的设置可以参考官方的文档说明文档
option= {
title: {
text:'iphone销量',
subtext:'纯属虚构',
x:'center'
},
tooltip: {
trigger:'item'
},
legend: {
orient:'vertical',
x:'left',
data: ['iphone3','iphone4','iphone5']
},
dataRange: {
min:0,
max:2500,
text: ['高','低'],
calculable:true,
textStyle: {
color:'orange'
}
},
toolbox: {
show:true,
orient:'vertical',
x:'right',
y:'center',
feature: {
mark:true,
dataView: { readOnly:false },
restore:true,
saveAsImage:true
}
},
series: [
{
name:'iphone3',
type:'map',
mapType:'china',
selectedMode: 'single',
itemStyle: {
normal: { label: { show:true },color:'#ffd700' },// for legend
emphasis: { label: { show:true} }
},
data: [
{ name:'北京',value:Math.round(Math.random() *1000) },
{ name:'天津',value:Math.round(Math.random() *1000) },
{ name:'上海',value:Math.round(Math.random() *1000) },
{ name:'重庆',value:Math.round(Math.random() *1000) },
{ name:'河北',value:Math.round(Math.random() *1000) },
{ name:'河南',value:Math.round(Math.random() *1000) },
{ name:'云南',value:Math.round(Math.random() *1000) },
{ name:'辽宁',value:Math.round(Math.random() *1000) },
{ name:'黑龙江',value:Math.round(Math.random() *1000) },
{ name:'湖南',value:Math.round(Math.random() *1000) },
{ name:'安徽',value:Math.round(Math.random() *1000) },
{ name:'山东',value:Math.round(Math.random() *1000) },
{ name:'新疆',value:Math.round(Math.random() *1000) },
{ name:'江苏',value:Math.round(Math.random() *1000) },
{ name:'浙江',value:Math.round(Math.random() *1000) },
{ name:'江西',value:Math.round(Math.random() *1000) },
{ name:'湖北',value:Math.round(Math.random() *1000) },
{ name:'广西',value:Math.round(Math.random() *1000) },
{ name:'甘肃',value:Math.round(Math.random() *1000) },
{ name:'山西',value:Math.round(Math.random() *1000) },
{ name:'内蒙古',value:Math.round(Math.random() *1000) },
{ name:'陕西',value:Math.round(Math.random() *1000) },
{ name:'吉林',value:Math.round(Math.random() *1000) },
{ name:'福建',value:Math.round(Math.random() *1000) },
{ name:'贵州',value:Math.round(Math.random() *1000) },
{ name:'广东',value:Math.round(Math.random() *1000) },
{ name:'青海',value:Math.round(Math.random() *1000) },
{ name:'西藏',value:Math.round(Math.random() *1000) },
{ name:'四川',value:Math.round(Math.random() *1000) },
{ name:'宁夏',value:Math.round(Math.random() *1000) },
{ name:'海南',value:Math.round(Math.random() *1000) },
{ name:'台湾',value:Math.round(Math.random() *1000) },
{ name:'香港',value:Math.round(Math.random() *1000) },
{ name:'澳门',value:Math.round(Math.random() *1000) }
]
},
{
name:'iphone4',
type:'map',
mapType:'china',
selectedMode: 'single',
itemStyle: {
normal: { label: { show:true },color:'#ff8c00' },// for legend
emphasis: { label: { show:true} }
},
data: [
{ name:'北京',value:Math.round(Math.random() *1000) },
{ name:'天津',value:Math.round(Math.random() *1000) },
{ name:'上海',value:Math.round(Math.random() *1000) },
{ name:'重庆',value:Math.round(Math.random() *1000) },
{ name:'河北',value:Math.round(Math.random() *1000) },
{ name:'安徽',value:Math.round(Math.random() *1000) },
{ name:'新疆',value:Math.round(Math.random() *1000) },
{ name:'浙江',value:Math.round(Math.random() *1000) },
{ name:'江西',value:Math.round(Math.random() *1000) },
{ name:'山西',value:Math.round(Math.random() *1000) },
{ name:'内蒙古',value:Math.round(Math.random() *1000) },
{ name:'吉林',value:Math.round(Math.random() *1000) },
{ name:'福建',value:Math.round(Math.random() *1000) },
{ name:'广东',value:Math.round(Math.random() *1000) },
{ name:'西藏',value:Math.round(Math.random() *1000) },
{ name:'四川',value:Math.round(Math.random() *1000) },
{ name:'宁夏',value:Math.round(Math.random() *1000) },
{ name:'香港',value:Math.round(Math.random() *1000) },
{ name:'澳门',value:Math.round(Math.random() *1000) }
]
},
{
name:'iphone5',
type:'map',
mapType:'china',
selectedMode: 'single',
itemStyle: {
normal: { label: { show:true },color:'#da70d6' },// for legend
emphasis: { label: { show:true} }
},
data: [
{ name:'北京',value:Math.round(Math.random() *1000) },
{ name:'天津',value:Math.round(Math.random() *1000) },
{ name:'上海',value:Math.round(Math.random() *1000) },
{ name:'广东',value:Math.round(Math.random() *1000) },
{ name:'台湾',value:Math.round(Math.random() *1000) },
{ name:'香港',value:Math.round(Math.random() *1000) },
{ name:'澳门',value:Math.round(Math.random() *1000) }
]
}
]
};
//以下的这段代码主要是用来处理用户的选择,应用场景是可以做地图的交互,比如点击地图上的某一个省,获取相应的省的指标变化等。
//需要特别注意的是,如果需要点击某一省作地图的操作交互的话,还需要为series属性的每一项添加一个selectedMode属性,这里的属性值为 'single'即单选,也可多选
varecConfig= require('echarts/config');
myChart.on(ecConfig.EVENT.MAP_SELECTED,function (param) {
varselected=param.selected;
varmapSeries=option.series[0];
vardata= [];
varlegendData= [];
varname;
for (varp=0,len=mapSeries.data.length; p<len; p++) {
name=mapSeries.data[p].name;
mapSeries.data[p].selected=selected[name];
if (selected[name]) {
alert(name); //这里只是简单的做一个事例说明,弹出用户所选的省,如需做其他的扩展,可以在这里边添加相应的操作
}
}
});
myChart.setOption(option);
}
);
</script>
地図グラフを除き、他のアイコンも同様に使用されます。実際、他のチャートとマップ チャートの違いは、構成ファイルへの参照です。ここでは折れ線グラフの例を示します。他の例も同様です。

<scripttype="text/javascript">
require.config({
paths: {
echarts:'./echarts/echarts',
'echarts/chart/bar':'./echarts/echarts',//这里需要注意的是除了mapchart使用的配置文件为echarts-map之外,
其他的图形引用的配置文件都为echarts,这也是一般的图形跟地图的区别
'echarts/chart/line':'./echarts/echarts'
}
});
require(
[
'echarts',
'echarts/chart/bar',
'echarts/chart/line'
],
function (ec) {
varmyChart=ecinit(documentgetElementById('main'));
option= {
tooltip: {
trigger:'axis'
},
legend: {
data: ['邮件营销','联盟广告','视频广告','直接问','搜索引擎']
},
toolbox: {
show:true,
feature: {
mark:true,
dataView: { readOnly:false },
magicType: ['line','bar'],
restore:true,
saveAsImage:true
}
},
calculable:true,
xAxis: [
{
type:'category',
boundaryGap:false,
data: ['周一','周二','周三','周四','周五','周六','周日']
}
],
yAxis: [
{
type:'value',
splitArea: { show:true }
}
],
series: [
{
name:'邮件营销',
type:'line',
stack:'总量',
data: [120,132,101,134,90,230,210]
},
{
name:'联盟广告',
type:'line',
stack:'总量',
data: [220,182,191,234,290,330,310]
},
{
name:'视频广告',
type:'line',
stack:'总量',
data: [150,232,201,154,190,330,410]
},
{
name:'直接访问',
type:'line',
stack:'总量',
data: [320,332,301,334,390,330,320]
},
{
name:'搜索引擎',
type:'line',
stack:'总量',
data: [820,932,901,934,1290,1330,1320]
}
]
};
myChart.setOption(option);
}
);
</script>
<pid="main1"style="height:500px;border:1px solid #ccc;padding:10px;"></p>
<scripttype="text/javascript">
require.config({
paths: {
echarts:'./echarts/echarts',
'echarts/chart/bar':'./echarts/echarts',
'echarts/chart/line':'./echarts/echarts'
}
});
require(
[
'echarts',
'echarts/chart/bar',
'echarts/chart/line'
],
function (ec) {
varmyChart=ecinit(documentgetElementById('main1'));
option= {
title: {
text:'未来一周气温变化',
subtext:'纯属虚构'
},
tooltip: {
trigger:'axis'
},
legend: {
data: ['最高气温'最低气温']
},
toolbox: {
show:true,
feature: {
mark:true,
dataView: { readOnly:false },
magicType: ['line','bar'],
restore:true,
saveAsImage:true
}
},
calculable:true,
xAxis: [
{
type:'category',
boundaryGap:false,
data: ['周一','周二','周三','周四','周五','周六','周日']
}
],
yAxis: [
{
type:'value',
axisLabel: {
formatter:'{value} '
},
splitArea: { show:true }
}
],
series: [
{
name:'最高气温',
type:'line',
itemStyle: {
normal: {
lineStyle: {
shadowColor:'rgba(0,0,0,4)'
}
}
},
data: [11,11,15,13,12,13,10]
},
{
name:'最低气温',
type:'line',
itemStyle: {
normal: {
lineStyle: {
shadowColor:'rgba(0,0,0,4)'
}
}
},
data: [-2,1,2,5,3,2,0]
}
]
};
myChart.setOption(option);
}
);
</script>
<pid="main2"style="height:500px;border:1px solid #ccc;padding:10px;"></p>
<scripttype="text/javascript">
require.config({
paths: {
echarts:'./echarts/echarts',
'echarts/chart/bar':'./echarts/echarts',
'echarts/chart/line':'./echarts/echarts'
}
});
require(
[
'echarts',
'echarts/chart/bar',
'echarts/chart/line'
],
function (ec) {
varmyChart=ec.init(document.getElementById('main2'));
option= {
title: {
text:'某楼盘销售情况',
subtext:'纯属虚构'
},
tooltip: {
trigger:'axis'
},
legend: {
data: ['意向','预购','成交']
},
toolbox: {
show:true,
feature: {
mark:true,
dataView: { readOnly:false },
magicType: ['line','bar'],
restore:true,
saveAsImage:true
}
},
calculable:true,
xAxis: [
{
type:'category',
boundaryGap:false,
data: ['周','周二','周三','周四','周五','周六','周日']
}
],
yAxis: [
{
type:'value'
}
],
series: [
{
name:'成交',
type:'line',
smooth:true,
itemStyle: { normal: { areaStyle: { type:'default'}} },
data: [10,12,21,54,260,830,710]
},
{
name:'预购',
type:'line',
smooth:true,
itemStyle: { normal: { areaStyle: { type:'default'}} },
data: [30,182,434,791,390,30,10]
},
{
name:'意向',
type:'line',
smooth:true,
itemStyle: { normal: { areaStyle: { type:'default'}} },
data: [1320,1132,601,234,120,90,20]
}
]
};
myChart.setOption(option);
}
);
</script>上記の操作を完了すると、効果の画像は次のようになります:
以上がechartプラグインの基本的な使い方などを紹介の詳細内容です。詳細については、PHP 中国語 Web サイトの他の関連記事を参照してください。


![[Web フロントエンド] Node.js クイック スタート](https://img.php.cn/upload/course/000/000/067/662b5d34ba7c0227.png)


