ポリラインの線の色とポリラインの点の色を設定する echart の例
この記事では、折れ線グラフの折れ線と折れ線点の色を設定する jQuery プラグイン echart の方法を主に紹介し、折れ線グラフを設定するための jQuery プラグイン echart の関連操作スキルを分析します。必要な友達が参考になれば幸いです。
1. 問題の背景
折れ線グラフをデザインしますが、グラフィックスは線と頂点の色をカスタマイズする必要があります
2.コード
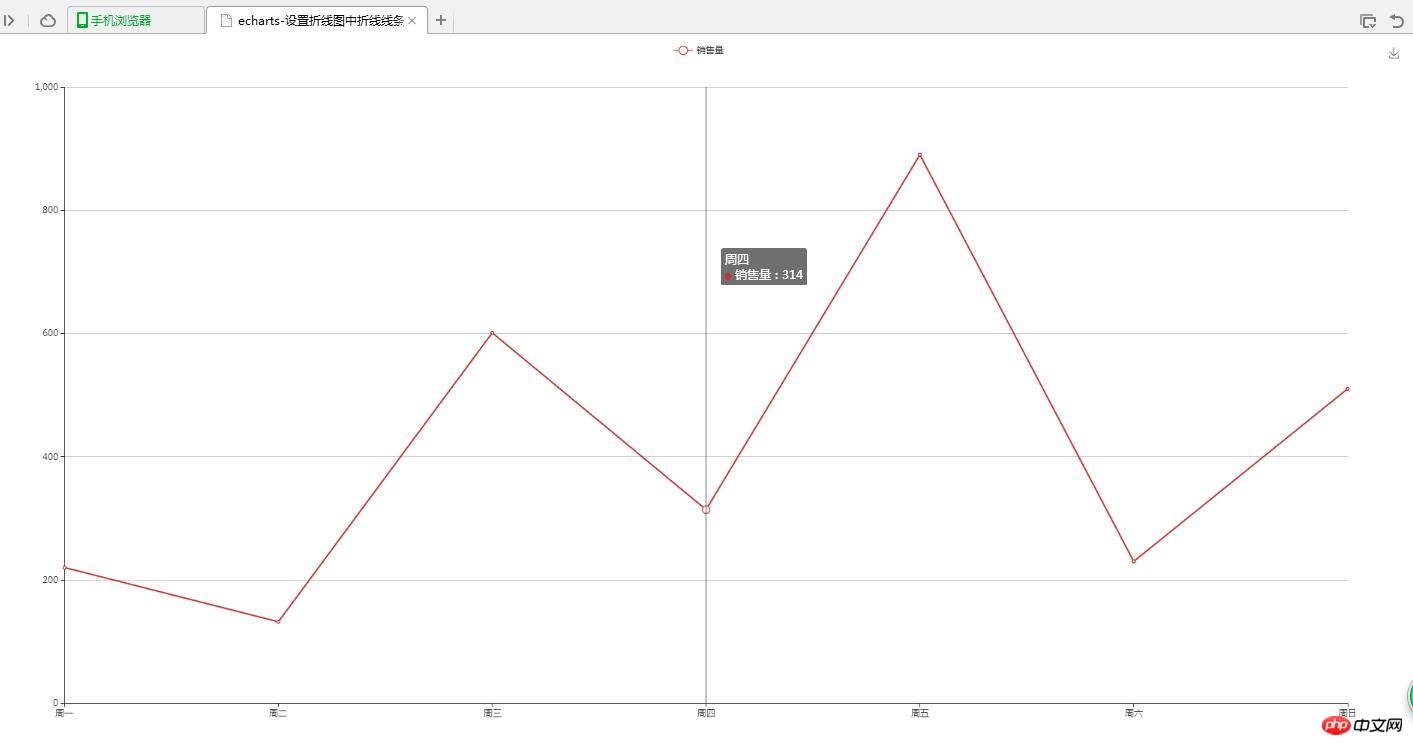
(1) グラフィック自己割り当てカラー
<!DOCTYPE html>
<html>
<head>
<meta charset="UTF-8">
<title>echarts-设置折线图中折线线条颜色和折线点颜色</title>
<link rel="shortcut icon" href="../js/echarts-2.2.7/doc/asset/ico/favicon.png" rel="external nofollow" rel="external nofollow" rel="external nofollow" >
<script type="text/javascript" src="../js/echarts-2.2.7/doc/asset/js/jquery.min.js" ></script>
<script type="text/javascript" src="../js/echarts-2.2.7/doc/example/www2/js/echarts-all.js" ></script>
<style>
body,html{
width: 99%;
height: 99%;
font-family: "微软雅黑";
font-size: 12px;
}
#line{
width: 100%;
height: 100%;
}
</style>
<script>
$(function(){
var chart = document.getElementById('line');
var echart = echarts.init(chart);
var option = {
title: {
text: ''
},
tooltip: {
trigger: 'axis'
},
legend: {
data:['销售量']
},
grid: {
left: '3%',
right: '4%',
bottom: '3%',
containLabel: true
},
toolbox: {
feature: {
saveAsImage: {}
}
},
xAxis: {
type: 'category',
boundaryGap: false,
data: ['周一','周二','周三','周四','周五','周六','周日']
},
yAxis: {
type: 'value'
},
series: [
{
name:'销售量',
type:'line',
stack: '销售量',
data:[220, 132, 601, 314, 890, 230, 510]
}
]
};
echart.setOption(option);
});
</script>
</head>
<body>
<p id="line"></p>
</body>
</html>(2) 線カスタムカラー
<!DOCTYPE html>
<html>
<head>
<meta charset="UTF-8">
<title>echarts-设置折线图中折线线条颜色和折线点颜色</title>
<link rel="shortcut icon" href="../js/echarts-2.2.7/doc/asset/ico/favicon.png" rel="external nofollow" rel="external nofollow" rel="external nofollow" >
<script type="text/javascript" src="../js/echarts-2.2.7/doc/asset/js/jquery.min.js" ></script>
<script type="text/javascript" src="../js/echarts-2.2.7/doc/example/www2/js/echarts-all.js" ></script>
<style>
body,html{
width: 99%;
height: 99%;
font-family: "微软雅黑";
font-size: 12px;
}
#line{
width: 100%;
height: 100%;
}
</style>
<script>
$(function(){
var chart = document.getElementById('line');
var echart = echarts.init(chart);
var option = {
title: {
text: ''
},
tooltip: {
trigger: 'axis'
},
legend: {
data:['销售量']
},
grid: {
left: '3%',
right: '4%',
bottom: '3%',
containLabel: true
},
toolbox: {
feature: {
saveAsImage: {}
}
},
xAxis: {
type: 'category',
boundaryGap: false,
data: ['周一','周二','周三','周四','周五','周六','周日']
},
yAxis: {
type: 'value'
},
series: [
{
name:'销售量',
type:'line',
stack: '销售量',
itemStyle : {
normal : {
lineStyle:{
 color:'#00FF00'
}
}
},
data:[220, 132, 601, 314, 890, 230, 510]
}
]
};
echart.setOption(option);
});
</script>
</head>
<body>
<p id="line"></p>
</body>
</html>(3) 頂点カスタムカラー
<!DOCTYPE html>
<html>
<head>
<meta charset="UTF-8">
<title>echarts-设置折线图中折线线条颜色和折线点颜色</title>
<link rel="shortcut icon" href="../js/echarts-2.2.7/doc/asset/ico/favicon.png" rel="external nofollow" rel="external nofollow" rel="external nofollow" >
<script type="text/javascript" src="../js/echarts-2.2.7/doc/asset/js/jquery.min.js" ></script>
<script type="text/javascript" src="../js/echarts-2.2.7/doc/example/www2/js/echarts-all.js" ></script>
<style>
body,html{
width: 99%;
height: 99%;
font-family: "微软雅黑";
font-size: 12px;
}
#line{
width: 100%;
height: 100%;
}
</style>
<script>
$(function(){
var chart = document.getElementById('line');
var echart = echarts.init(chart);
var option = {
title: {
text: ''
},
tooltip: {
trigger: 'axis'
},
legend: {
data:['销售量']
},
grid: {
left: '3%',
right: '4%',
bottom: '3%',
containLabel: true
},
toolbox: {
feature: {
saveAsImage: {}
}
},
xAxis: {
type: 'category',
boundaryGap: false,
data: ['周一','周二','周三','周四','周五','周六','周日']
},
yAxis: {
type: 'value'
},
series: [
{
name:'销售量',
type:'line',
stack: '销售量',
itemStyle : {
normal : {
color:'#00FF00',
lineStyle:{
color:'#00FF00'
}
}
},
data:[220, 132, 601, 314, 890, 230, 510]
}
]
};
echart.setOption(option);
});
</script>
</head>
<body>
<p id="line"></p>
</body>
</html>3. 実装結果
(1) グラフィック自己割り当てカラー

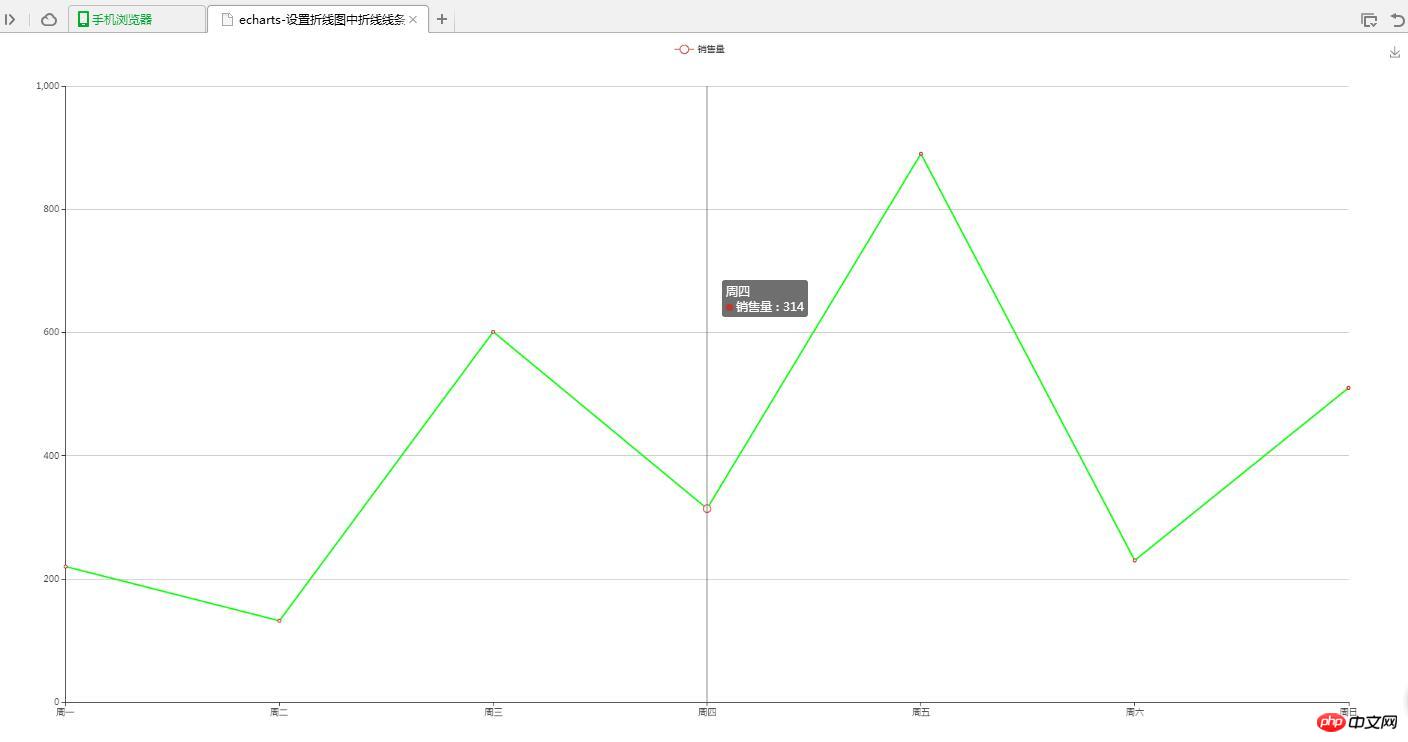
(2) 線の自己定義色

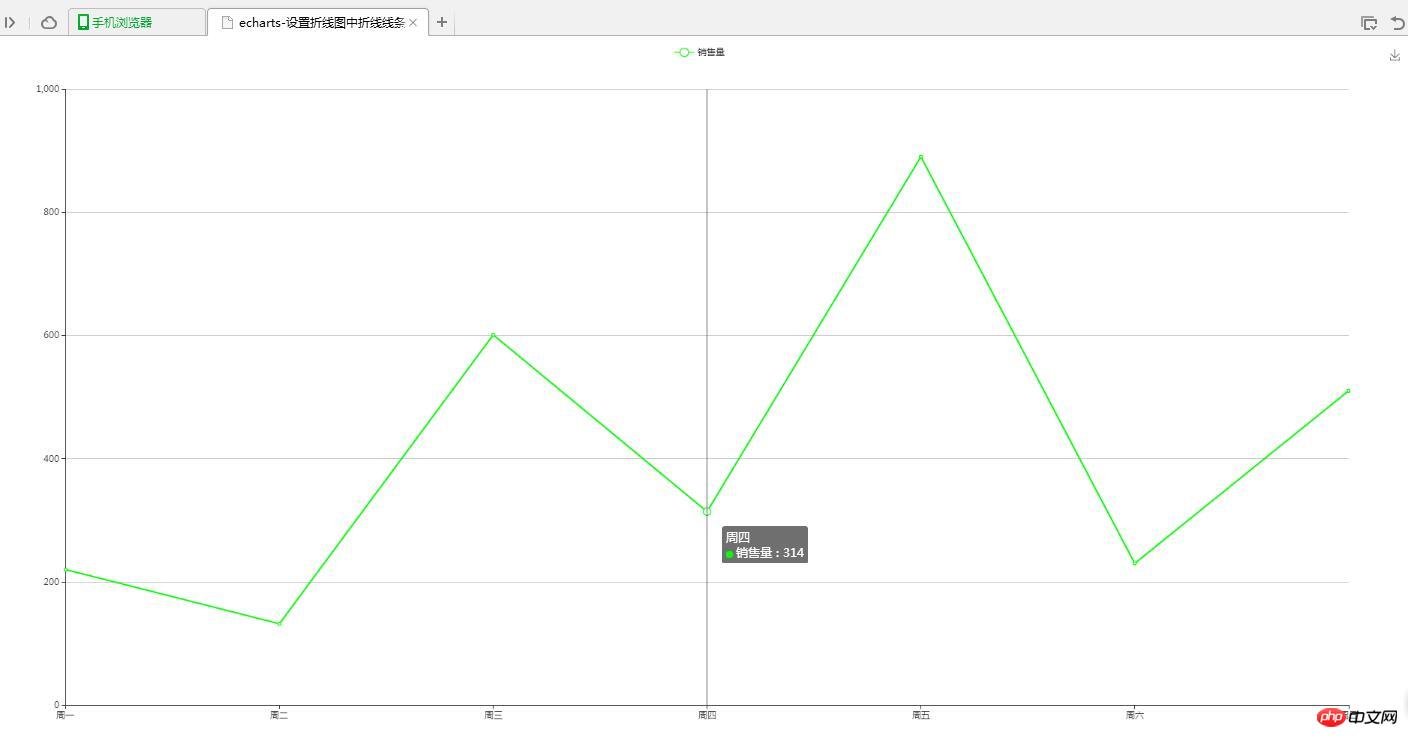
(3) 頂点のカスタムカラー

4. 問題の説明
(1) ポリラインの線色の設定
lineStyle:{
color:'#00FF00'
}(2) 設定ポリラインの頂点カラー
itemStyle : {
 normal : {
  color:'#00FF00'
 }
}関連推奨:
jQuery プラグイン echarts を使用して垂直グリッド線を削除する方法の詳細な説明
echarts によって実装された周期的に生成されるグラフ効果の例の共有
例の共有echarts が X 軸、Y 軸、グリッド線を削除する効果をどのように実装するか
以上がポリラインの線の色とポリラインの点の色を設定する echart の例の詳細内容です。詳細については、PHP 中国語 Web サイトの他の関連記事を参照してください。

ホットAIツール

Undresser.AI Undress
リアルなヌード写真を作成する AI 搭載アプリ

AI Clothes Remover
写真から衣服を削除するオンライン AI ツール。

Undress AI Tool
脱衣画像を無料で

Clothoff.io
AI衣類リムーバー

Video Face Swap
完全無料の AI 顔交換ツールを使用して、あらゆるビデオの顔を簡単に交換できます。

人気の記事

ホットツール

メモ帳++7.3.1
使いやすく無料のコードエディター

SublimeText3 中国語版
中国語版、とても使いやすい

ゼンドスタジオ 13.0.1
強力な PHP 統合開発環境

ドリームウィーバー CS6
ビジュアル Web 開発ツール

SublimeText3 Mac版
神レベルのコード編集ソフト(SublimeText3)

ホットトピック
 7690
7690
 15
15
 1639
1639
 14
14
 1393
1393
 52
52
 1287
1287
 25
25
 1229
1229
 29
29
 PHPインターフェイスとEChartsを使用して視覚的な統計グラフを生成する方法
Dec 18, 2023 am 11:39 AM
データの視覚化がますます重要になっている今日の状況において、多くの開発者は、さまざまなツールを使用してさまざまなチャートやレポートを迅速に生成し、データをより適切に表示し、意思決定者が迅速な判断を下せるようにしたいと考えています。この文脈では、Php インターフェイスと ECharts ライブラリを使用すると、多くの開発者が視覚的な統計グラフを迅速に生成するのに役立ちます。この記事では、Php インターフェイスと ECharts ライブラリを使用して視覚的な統計グラフを生成する方法を詳しく紹介します。具体的な実装ではMySQLを使用します。
 Windows 10のタスクバーの色を変更する方法
Jan 01, 2024 pm 09:05 PM
Windows 10 でタスク バーの色を変更するのは非常に簡単ですが、多くのユーザーは設定できないことに気づきました。実際、それは非常に簡単です。コンピューターの個人用設定で好みの色を選択するだけです。色を変更できない場合は、細かい設定にも注目してください。 Win10 タスクバーの色を変更する方法 ステップ 1: デスクトップを右クリックし、[個人設定] をクリックします。 ステップ 2: カラー領域をカスタマイズします。 ステップ 3: 好きな色を選択します。 PS: 色を変更できない場合は、[色] -> [色] をクリックします。 [色] -> [カスタマイズ] -> [デフォルトのウィンドウ モード] を選択し、暗い色を選択します。
 ECharts と Python インターフェイスを使用してダッシュボードを描画する手順
Dec 18, 2023 am 08:40 AM
ECharts と Python インターフェイスを使用してダッシュボードを描画する手順には、特定のコード サンプルが必要です 概要: ECharts は、Python インターフェイスを通じてデータ処理とグラフィック描画を簡単に実行できる優れたデータ視覚化ツールです。この記事では、ECharts と Python インターフェイスを使用してダッシュボードを描画する具体的な手順とサンプル コードを紹介します。キーワード: ECharts、Python インターフェイス、ダッシュボード、データ視覚化 はじめに ダッシュボードは、データ視覚化の一般的に使用される形式であり、
 マップ ヒート マップを使用して ECharts で都市の熱を表示する方法
Dec 18, 2023 pm 04:00 PM
マップ ヒート マップを使用して ECharts で都市熱を表示する方法 ECharts は、マップ ヒート マップなど、開発者が使用できるさまざまなチャート タイプを提供する強力なビジュアル チャート ライブラリです。マップ ヒート マップを使用すると、都市や地域の人気を示すことができ、さまざまな場所の人気や密度を迅速に把握するのに役立ちます。この記事では、ECharts でマップ ヒート マップを使用して都市の熱を表示する方法を紹介し、参考となるコード例を示します。まず、地理情報を含むマップ ファイル、EC が必要です。
 Vivo の新しい X100 シリーズ メモリ、カラー露出: すべてのシリーズは 12+256GB から始まります
May 06, 2024 pm 03:58 PM
5月6日のニュースによると、vivoは本日、新しいvivoX100シリーズが5月13日19時に正式にリリースされると正式に発表しました。このカンファレンスでは、vivoX100s、vivoX100sPro、vivoX100Ultraの3モデルと、vivoの自社開発イメージングブランドBlueImageブループリントイメージング技術が発表される予定であることがわかった。デジタルブロガー「Digital Chat Station」も本日、これら3モデルの公式レンダリング、メモリ仕様、カラーマッチングを公開しており、このうちX100sはストレートスクリーンデザインを採用しているのに対し、X100sProとX100Ultraは曲面スクリーンデザインを採用している。ブロガーは、vivoX100s にはブラック、チタン、シアン、ホワイトの 4 つの色があることを明らかにしました。 メモリの仕様。
 カレンダー チャートを使用して ECharts に時間データを表示する方法
Dec 18, 2023 am 08:52 AM
カレンダー チャートを使用して ECharts で時間データを表示する方法 ECharts (Baidu のオープン ソース JavaScript チャート ライブラリ) は、強力で使いやすいデータ視覚化ツールです。折れ線グラフ、棒グラフ、円グラフなど、さまざまな種類のグラフが提供されています。カレンダー チャートは、ECharts の非常に特徴的で実用的なチャート タイプであり、時間関連のデータを表示するために使用できます。この記事では、ECharts でカレンダー チャートを使用する方法を紹介し、具体的なコード例を示します。まず、使用する必要があります
 WPSドキュメントテーブルの色の設定方法をご存知ですか?
Mar 20, 2024 am 08:19 AM
他の人の WPS ドキュメントのテーブル カラーを見ると、効果はカラフルで美しいですが、私たちは単調な黒しかありません。表を色で埋めなければならない場合、多くの学生がそうするでしょう。しかし、WPS ドキュメント China でテーブルの色を設定したい場合、多くの学生は間違いなく混乱するでしょう。今日は、WPS ドキュメントテーブルの色の設定方法を学びましょう。皆様のお役に立てればと思い、資料を作成させていただきました。手順は次のとおりです。 1. WPS ドキュメント内に表を描画し、線の色を変更する表を右クリックする必要があります。 2. 次に、表上でマウスを右クリックし、ポップアップメニューに「枠線と網かけ」が表示されます。 3. このとき、[境界線と網かけ]オプションが開きます。
 Win7モニターの色異常問題の解決方法
Jan 14, 2024 pm 06:54 PM
コンピューターを長期間使用すると、さまざまな問題が発生することはわかっています。最も一般的なのはモニターの問題です。多くのユーザーは、モニターの色が異常に遭遇したことがあります。では、Win7 でもモニターの色が異常に遭遇した場合はどうすればよいですか? はい、解決策を見てみましょう。 Win7 モニターの色が異常な場合の対処方法: 一般的なモニター障害現象は次のとおりです。 1. コンピューターの電源を入れても表示がなく、モニターの電源が入らないことがよくあります。 2. モニター画面の文字がぼやける。 3. モニターに色斑があります。 4. モニターに波状の色の縞模様が表示されます。 5. モニターに独特の臭いがします。 6. モニターから「ポン」という音が継続的に聞こえます。 7. 特定のアプリケーションまたは構成では、画面がぼやけたり、暗くなったり (または黒く見えたり)、ゴーストが発生したり、フリーズしたりする場合があります。 8. ディスプレイに色がない、焦点がぼやけている、画面が明るすぎる、または


