html5+canvasで円グラフを動的に実装する手順を詳しく解説
今回は、html5+canvasで円グラフを動的に実装する手順について詳しく説明します。 html5+canvasで円グラフを動的に実装するための注意事項を紹介します。見て。
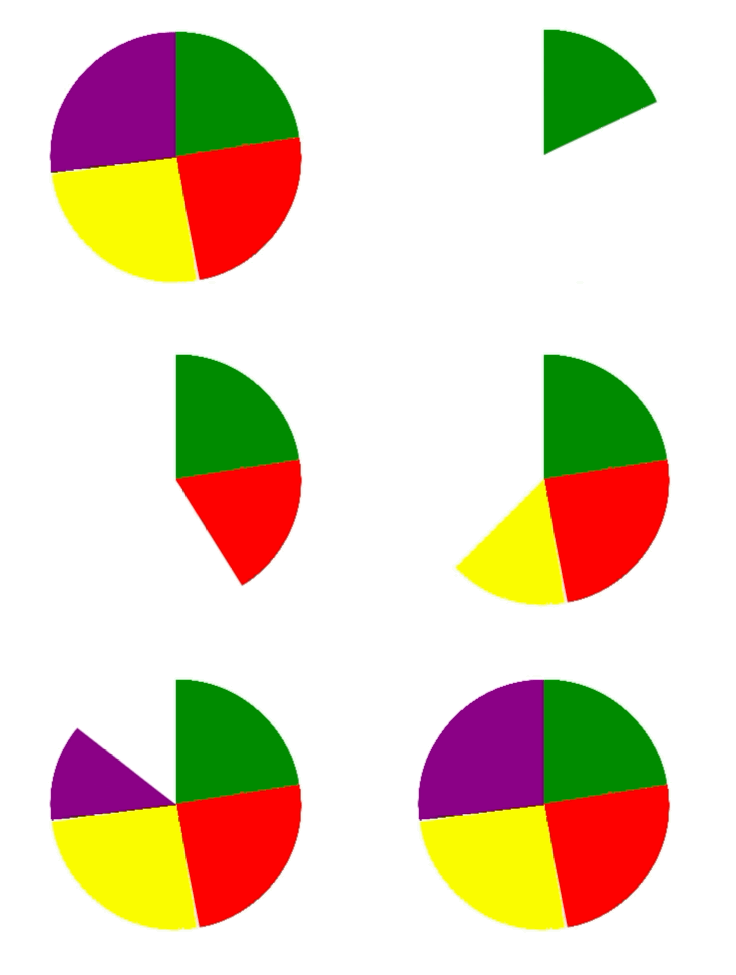
まずレンダリングを見てみましょう

これはjqueryなどのサードパーティライブラリを参照するのではなく、domオペレーションとcanvasの機能を使用して書かれています。
キャンバス上に描かれた円は、一般に実線の円と中空の円に分けられます。
需要分析に基づいて、この円は実線の円であることがわかります。
1. まず、キャンバスを使用して実線の円を描画します

//伪代码
var canvas = document.createElement("canvas");
var ctx = canvas.getContext('2d');
ctx.beginPath();
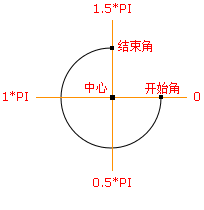
ctx.arc(圆心x轴坐标,圆心y轴坐标,半径,开始角,结束角);
ctx.fillStyle = 'green';
ctx.closePath();
ctx.fill();2. さまざまな色に従って円グラフを描画します
//伪代码
var canvas = document.createElement("canvas");
var ctx = canvas.getContext('2d');
ctx.beginPath();
ctx.arc(圆心x轴坐标,圆心y轴坐标,半径,绿色开始角,绿色结束角);
ctx.fillStyle = 'green';
ctx.closePath();
ctx.fill();
ctx.beginPath();
ctx.arc(圆心x轴坐标,圆心y轴坐标,半径,红色开始角,红色结束角);
ctx.fillStyle = 'red';
ctx.closePath();
ctx.fill();
ctx.beginPath();
ctx.arc(圆心x轴坐标,圆心y轴坐标,半径,黄色开始角,黄色结束角);
ctx.fillStyle = 'yellow';
ctx.closePath();
ctx.fill();
ctx.beginPath();
ctx.arc(圆心x轴坐标,圆心y轴坐标,半径,紫色开始角,紫色结束角);
ctx.fillStyle = 'purple';
ctx.closePath();
ctx.fill();3. 円グラフを動的に描画するには、一般的に 3 つの方法が推奨されます。インターネット上のサークル: requestAnimationFrame、setInterval (タイミング)、および動的角度計算。
ここでは最初の requestAnimationFrame メソッドを使用します。
書き込み中に問題が見つかりました。つまり、円を動的に描画するときに、円の中心の座標に基づいて描画されません。この問題を解決するには、円を描画するたびにキャンバス ブラシの座標を元の円の中心の座標として再定義する必要があります。
<!DOCTYPE html>
<html>
<head>
<meta charset="utf-8">
<title></title>
<style>
#graph {
/* border: 1px solid black;
height: 100%;
width: 100%;
box-sizing: border-box;*/
}
</style>
</head>
<body>
<p id="circle" style="width: 500px;float: left;"></p>
</body>
</html>
<script type="text/javascript">
(function(window,undefined){
var data = [
{"product":"产品1","sales":[192.44 ,210.54 ,220.84 ,230.11 ,220.85 ,210.59 ,205.49 ,200.55 ,195.71 ,187.46 ,180.66 ,170.90]},
{"product":"产品2","sales":[122.41 ,133.16 ,145.65 ,158.00 ,164.84 ,178.62 ,185.70 ,190.13 ,195.53 ,198.88 ,204.32 ,210.91]},
{"product":"产品3","sales":[170.30 ,175.00 ,170.79 ,165.10 ,165.62 ,160.92 ,155.92 ,145.77 ,145.17 ,140.27 ,135.99 ,130.33]},
{"product":"产品4","sales":[165.64 ,170.15 ,175.10 ,185.32 ,190.90 ,190.01 ,187.05 ,183.74 ,177.24 ,181.90 ,179.54 ,175.98]}
]
var dom_circle = document.getElementById('circle');
if(dom_circle != undefined && dom_circle != null)
{
var canvas = document.createElement("canvas");
dom_circle.appendChild(canvas);
var ctx = canvas.getContext('2d');
var defaultStyle = function(Dom,canvas){
if(Dom.clientWidth <= 300)
{
canvas.width = 300;
Dom.style.overflowX = "auto";
}
else{
canvas.width = Dom.clientWidth;
}
if(Dom.clientHeight <= 300)
{
canvas.height = 300;
Dom.style.overflowY = "auto";
}
else
{
canvas.height = Dom.clientHeight;
}
//坐标轴区域
//注意,实际画折线图区域还要比这个略小一点
return {
p1:'green',
p2:'red',
p3:'yellow',
p4:'purple',
x: 0 , //坐标轴在canvas上的left坐标
y: 0 , //坐标轴在canvas上的top坐标
maxX: canvas.width , //坐标轴在canvas上的right坐标
maxY: canvas.height , //坐标轴在canvas上的bottom坐标
r:(canvas.width)/2, //起点
ry:(canvas.height)/2, //起点
cr: (canvas.width)/4, //半径
startAngle:-(1/2*Math.PI), //开始角度
endAngle:(-(1/2*Math.PI)+2*Math.PI), //结束角度
xAngle:1*(Math.PI/180) //偏移量
};
}
//画圆
var tmpAngle = -(1/2*Math.PI);
var ds = null;
var sum = data[0]['sales'][0]+data[0]['sales'][1]+data[0]['sales'][2]+data[0]['sales'][3]
var percent1 = data[0]['sales'][0]/sum * Math.PI * 2 ;
var percent2 = data[0]['sales'][1]/sum * Math.PI * 2 + percent1;
var percent3 = data[0]['sales'][2]/sum * Math.PI * 2 + percent2;
var percent4 = data[0]['sales'][3]/sum * Math.PI * 2 + percent3;
console.log(percent1);
console.log(percent2);
console.log(percent3);
console.log(percent4);
var tmpSum = 0;
var drawCircle = function(){
if(tmpAngle >= ds.endAngle)
{
return false;
}
else if(tmpAngle+ ds.xAngle > ds.endAngle)
{
tmpAngle = ds.endAngle;
}
else{
tmpAngle += ds.xAngle;
tmpSum += ds.xAngle
}
// console.log(ds.startAngle+'***'+tmpAngle);
// console.log(tmpSum);
// ctx.clearRect(ds.x,ds.y,canvas.width,canvas.height);
if(tmpSum > percent1 && tmpSum <percent2)
{
ctx.beginPath();
ctx.moveTo(ds.r,ds.ry);
ctx.arc(ds.r,ds.ry,ds.cr,ds.startAngle+percent1,tmpAngle);
ctx.fillStyle = ds.p2;
}
else if(tmpSum > percent2 && tmpSum <percent3)
{
ctx.beginPath();
ctx.moveTo(ds.r,ds.ry);
ctx.arc(ds.r,ds.ry,ds.cr,ds.startAngle+percent2,tmpAngle);
ctx.fillStyle = ds.p3;
}
else if(tmpSum > percent3 )
{
ctx.beginPath();
ctx.moveTo(ds.r,ds.ry);
ctx.arc(ds.r,ds.ry,ds.cr,ds.startAngle+percent3,tmpAngle);
ctx.fillStyle = ds.p4;
}
else{
ctx.beginPath();
ctx.moveTo(ds.r,ds.ry);
ctx.arc(ds.r,ds.ry,ds.cr,ds.startAngle,tmpAngle);
ctx.fillStyle = ds.p1;
}
ctx.closePath();
ctx.fill();
requestAnimationFrame(drawCircle);
}
this.toDraw = function(){
ds= defaultStyle(dom_circle,canvas);
// console.log(tmpAngle);
// console.log(ds.xAngle)
ctx.clearRect(ds.x,ds.y,canvas.width,canvas.height);
drawCircle();
}
this.toDraw();
var self = this;
window.onresize = function(){
self.toDraw()
}
}
})(window);
</script>この記事の事例を読んだ後は、この方法を習得したと思います。さらに興味深い情報については、php 中国語 Web サイトの他の関連記事に注目してください。
推奨読書:
H5+WebWorkers マルチスレッド開発と使用法の詳細な説明H5 オフライン アプリケーションとクライアント ストレージの使用法の詳細な説明以上がhtml5+canvasで円グラフを動的に実装する手順を詳しく解説の詳細内容です。詳細については、PHP 中国語 Web サイトの他の関連記事を参照してください。

ホットAIツール

Undresser.AI Undress
リアルなヌード写真を作成する AI 搭載アプリ

AI Clothes Remover
写真から衣服を削除するオンライン AI ツール。

Undress AI Tool
脱衣画像を無料で

Clothoff.io
AI衣類リムーバー

AI Hentai Generator
AIヘンタイを無料で生成します。

人気の記事

ホットツール

メモ帳++7.3.1
使いやすく無料のコードエディター

SublimeText3 中国語版
中国語版、とても使いやすい

ゼンドスタジオ 13.0.1
強力な PHP 統合開発環境

ドリームウィーバー CS6
ビジュアル Web 開発ツール

SublimeText3 Mac版
神レベルのコード編集ソフト(SublimeText3)

ホットトピック
 7467
7467
 15
15
 1376
1376
 52
52
 77
77
 11
11
 18
18
 19
19
 GoogleマップをiPhoneのデフォルト地図にする方法
Apr 17, 2024 pm 07:34 PM
iPhone のデフォルトの地図は、Apple 独自の地理位置情報プロバイダーである Maps です。マップは改善されていますが、米国外ではうまく機能しません。 Googleマップと比べて何も提供するものはありません。この記事では、Google マップを iPhone のデフォルトの地図として使用するための実行可能な手順について説明します。 Google マップを iPhone のデフォルトの地図にする方法 Google マップを携帯電話のデフォルトの地図アプリとして設定するのは、思っているよりも簡単です。以下の手順に従ってください – 前提条件 – 携帯電話に Gmail がインストールされている必要があります。ステップ 1 – AppStore を開きます。ステップ 2 – 「Gmail」を検索します。ステップ 3 – Gmail アプリの横にある をクリックします
 この Apple ID は iTunes Store でまだ使用されていません: 修正
Jun 10, 2024 pm 05:42 PM
AppleIDを使用してiTunesStoreにログインすると、「このAppleIDはiTunesStoreで使用されていません」というエラーが画面に表示される場合があります。心配するようなエラー メッセージはありません。これらのソリューション セットに従って問題を修正できます。解決策 1 – 配送先住所を変更する iTunes Store にこのプロンプトが表示される主な理由は、AppleID プロファイルに正しい住所がないことです。ステップ 1 – まず、iPhone で iPhone 設定を開きます。ステップ 2 – AppleID は他のすべての設定の最上位にある必要があります。それで、開けてください。ステップ 3 – そこに到達したら、「支払いと配送」オプションを開きます。ステップ 4 – Face ID を使用してアクセスを確認します。ステップ
 WeChat最新版へのアップグレード手順(WeChat最新版へのアップグレード方法を簡単にマスター)
Jun 01, 2024 pm 10:24 PM
WeChat は、より良いユーザー エクスペリエンスを提供するために新しいバージョンを継続的にリリースしている中国のソーシャル メディア プラットフォームの 1 つです。 WeChat を最新バージョンにアップグレードすることは、家族や同僚と連絡を取り合ったり、友人と連絡を取り合ったり、最新の動向を把握したりするために非常に重要です。 1. 最新バージョンの機能と改善点を理解する WeChat をアップグレードする前に、最新バージョンの機能と改善点を理解することが非常に重要です。パフォーマンスの向上やバグ修正については、WeChat 公式 Web サイトまたはアプリ ストアのアップデート ノートを確認することで、新しいバージョンによってもたらされるさまざまな新機能について知ることができます。 2. 現在の WeChat バージョンを確認する WeChat をアップグレードする前に、携帯電話に現在インストールされている WeChat バージョンを確認する必要があります。クリックして WeChat アプリケーション「Me」を開き、メニュー「About」を選択すると、現在の WeChat バージョン番号が表示されます。 3. アプリを開きます
 WeChatビデオアカウントを閉鎖するにはどうすればよいですか? WeChatビデオアカウントを閉鎖するための詳細な手順
Jan 02, 2024 pm 11:57 PM
WeChat ビデオアカウントを閉鎖する方法を理解するには、まずチャット ソフトウェアである WeChat が非常に豊富な機能を備えていることを知る必要があります。 WeChat ビデオ アカウントには、人によって異なる機能があります。一般の人にとって、WeChat ビデオ アカウントは個人が撮影した短いビデオを共有するためのチャンネルにすぎず、興味深い WeChat ビデオを共有することができます。トラフィックを集めるために WeChat ビデオ アカウントを使用している人もいます。当然、荒らしや荒らしからのコメントは受け付けられないので、WeChatビデオアカウントを閉鎖したいと思うかもしれません。次に、このウェブサイトの編集者が WeChat ビデオ アカウントを閉鎖する方法を紹介します。興味のある友人は、ぜひ見に来てください。WeChat ビデオ アカウントを閉鎖する手順は次のとおりです。まず WeChat を開き、メイン画面に入ります。ページに移動し、「I」ボタンをクリックすると、次の画面が表示されます。
 ShazamアプリがiPhoneで動作しない:修正
Jun 08, 2024 pm 12:36 PM
iPhone の Shazam アプリに問題がありますか? Shazam は、曲を聞いて曲を見つけるのに役立ちます。ただし、Shazam が正常に動作しない場合、または曲が認識されない場合は、手動でトラブルシューティングを行う必要があります。 Shazam アプリの修復にはそれほど時間はかかりません。したがって、これ以上時間を無駄にすることなく、以下の手順に従って Shazam アプリの問題を解決してください。解決策 1 – 太字テキスト機能を無効にする iPhone の太字テキストが、Shazam が正しく動作しない原因である可能性があります。ステップ 1 – これは iPhone の設定からのみ実行できます。それで、開けてください。ステップ 2 – 次に、そこにある「ディスプレイと明るさ」設定を開きます。ステップ 3 – 「太字テキスト」が有効になっている場合
 iPhoneのスクリーンショットが機能しない: 修正方法
May 03, 2024 pm 09:16 PM
iPhone ではスクリーンショット機能が動作しませんか?スクリーンショットの撮影は非常に簡単で、音量を上げるボタンと電源ボタンを同時に押して携帯電話の画面を取得するだけです。ただし、デバイスでフレームをキャプチャする方法は他にもあります。解決策 1 – Assistive Touch の使用 Assistive Touch 機能を使用してスクリーンショットを撮ります。ステップ 1 – 電話の設定に移動します。ステップ 2 – 次に、タップしてアクセシビリティ設定を開きます。ステップ 3 – タッチ設定を開きます。ステップ 4 – 次に、Assistive Touch 設定を開きます。ステップ 5 – 携帯電話の Assistive Touch をオンにします。ステップ 6 – 「トップメニューのカスタマイズ」を開いてアクセスします。ステップ 7 – ここで必要なのは、これらの機能のいずれかを画面キャプチャにリンクすることだけです。それで最初をクリックしてください
 Win11のシステム管理者権限を取得する手順を詳しく解説
Mar 08, 2024 pm 09:09 PM
Windows 11は、マイクロソフトが発売した最新のオペレーティングシステムとして、ユーザーに深く愛されています。 Windows 11 を使用する過程で、権限が必要な操作を実行するためにシステム管理者権限を取得する必要がある場合があります。次に、Windows 11でシステム管理者権限を取得する手順を詳しく紹介します。まずは「スタートメニュー」をクリックすると、左下隅にWindowsのアイコンが表示されますので、このアイコンをクリックして「スタートメニュー」を開きます。 2 番目のステップでは、「」を見つけてクリックします。
 iPhone の Safari ズームの問題: これで解決します
Apr 20, 2024 am 08:08 AM
Safari でズーム レベルを制御できない場合、作業が困難になることがあります。したがって、Safari がズームアウトしているように見える場合は、それが問題である可能性があります。 Safari でのこの小さなズームの問題を解決する方法をいくつか紹介します。 1. カーソル拡大率:Safari メニューバーの「表示」>「カーソル拡大率」を選択します。これにより、カーソルが画面上でより見やすくなり、制御が容易になります。 2. マウスを移動します。これは簡単に聞こえるかもしれませんが、マウスを画面上の別の場所に移動するだけで、マウスが自動的に通常のサイズに戻ることがあります。 3. キーボード ショートカットを使用する 解決策 1 – ズーム レベルをリセットする Safari ブラウザから直接ズーム レベルを制御できます。ステップ 1 – Safari を使用している場合


