

Python は add_subplot と subplot を使用してサブプロットを描画します

この記事では、主に add_subplot と subplot を使用してサブプロットを描画するための Python の操作を紹介し、グラフィックス描画のための matplotlib モジュールを使用した Python の関連操作スキルについても説明します。必要な方は参考にしてください。 Pythonのadd_subplotとサブプロットを描画するsubplotが動作します。参考のために皆さんと共有してください。詳細は次のとおりです:
サブピクチャ:1つの図内に複数のサブピクチャを生成します。
Matplotlibオブジェクトの紹介FigureCanvas Canvas Figureと意味は同じです。
オブジェクト指向アプローチの使用
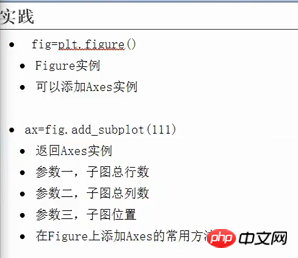
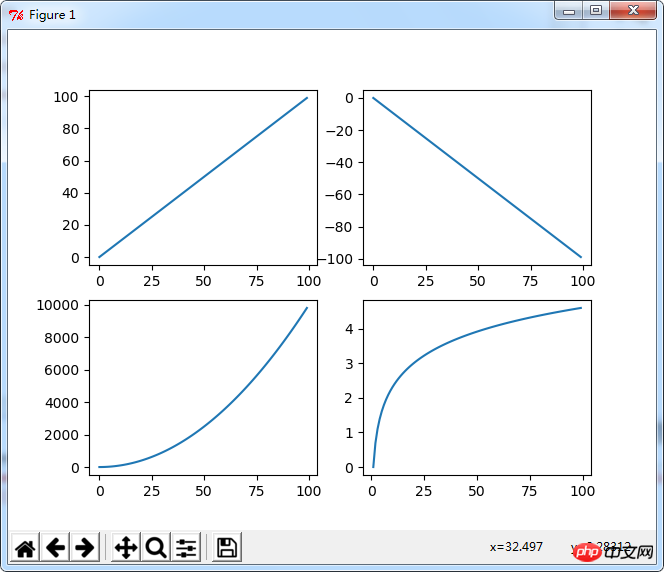
#!/usr/bin/python
#coding: utf-8
import numpy as np
import matplotlib.pyplot as plt
x = np.arange(0, 100)
fig = plt.figure()
ax1 = fig.add_subplot(221)
ax1.plot(x, x)
ax2 = fig.add_subplot(222)
ax2.plot(x, -x)
ax3 = fig.add_subplot(223)
ax3.plot(x, x ** 2)
ax4 = fig.add_subplot(224)
ax4.plot(x, np.log(x))
plt.show()
pyplotアプローチplt.subplot()参数和面向对象中的add_subplot()
#!/usr/bin/python
#coding: utf-8
import numpy as np
import matplotlib.pyplot as plt
x = np.arange(0, 100)
plt.subplot(221)
plt.plot(x, x)
plt.subplot(222)
plt.plot(x, -x)
plt.subplot(223)
plt.plot(x, x ** 2)
plt.subplot(224)
plt.plot(x, np.log(x))
plt.show()
実行結果:
関連推奨事項:
Windows API を使用してウィンドウのサンプルを作成する Python
以上がPython は add_subplot と subplot を使用してサブプロットを描画しますの詳細内容です。詳細については、PHP 中国語 Web サイトの他の関連記事を参照してください。

ホットAIツール

Undresser.AI Undress
リアルなヌード写真を作成する AI 搭載アプリ

AI Clothes Remover
写真から衣服を削除するオンライン AI ツール。

Undress AI Tool
脱衣画像を無料で

Clothoff.io
AI衣類リムーバー

Video Face Swap
完全無料の AI 顔交換ツールを使用して、あらゆるビデオの顔を簡単に交換できます。

人気の記事
ホットツール

メモ帳++7.3.1
使いやすく無料のコードエディター

SublimeText3 中国語版
中国語版、とても使いやすい

ゼンドスタジオ 13.0.1
強力な PHP 統合開発環境

ドリームウィーバー CS6
ビジュアル Web 開発ツール

SublimeText3 Mac版
神レベルのコード編集ソフト(SublimeText3)
ホットトピック
 7658
7658
 15
1393
52
91
11
38
113
15
1393
52
91
11
38
113

 PHPおよびPython:さまざまなパラダイムが説明されています
Apr 18, 2025 am 12:26 AM
PHPおよびPython:さまざまなパラダイムが説明されています
Apr 18, 2025 am 12:26 AM
PHPは主に手順プログラミングですが、オブジェクト指向プログラミング(OOP)もサポートしています。 Pythonは、OOP、機能、手続き上のプログラミングなど、さまざまなパラダイムをサポートしています。 PHPはWeb開発に適しており、Pythonはデータ分析や機械学習などのさまざまなアプリケーションに適しています。
 PHPとPythonの選択:ガイド
Apr 18, 2025 am 12:24 AM
PHPとPythonの選択:ガイド
Apr 18, 2025 am 12:24 AM
PHPはWeb開発と迅速なプロトタイピングに適しており、Pythonはデータサイエンスと機械学習に適しています。 1.PHPは、単純な構文と迅速な開発に適した動的なWeb開発に使用されます。 2。Pythonには簡潔な構文があり、複数のフィールドに適しており、強力なライブラリエコシステムがあります。
 Visual StudioコードはPythonで使用できますか
Apr 15, 2025 pm 08:18 PM
Visual StudioコードはPythonで使用できますか
Apr 15, 2025 pm 08:18 PM
VSコードはPythonの書き込みに使用でき、Pythonアプリケーションを開発するための理想的なツールになる多くの機能を提供できます。ユーザーは以下を可能にします。Python拡張機能をインストールして、コードの完了、構文の強調表示、デバッグなどの関数を取得できます。デバッガーを使用して、コードを段階的に追跡し、エラーを見つけて修正します。バージョンコントロールのためにGitを統合します。コードフォーマットツールを使用して、コードの一貫性を維持します。糸くずツールを使用して、事前に潜在的な問題を発見します。
 Windows 8でコードを実行できます
Apr 15, 2025 pm 07:24 PM
Windows 8でコードを実行できます
Apr 15, 2025 pm 07:24 PM
VSコードはWindows 8で実行できますが、エクスペリエンスは大きくない場合があります。まず、システムが最新のパッチに更新されていることを確認してから、システムアーキテクチャに一致するVSコードインストールパッケージをダウンロードして、プロンプトとしてインストールします。インストール後、一部の拡張機能はWindows 8と互換性があり、代替拡張機能を探すか、仮想マシンで新しいWindowsシステムを使用する必要があることに注意してください。必要な拡張機能をインストールして、適切に動作するかどうかを確認します。 Windows 8ではVSコードは実行可能ですが、開発エクスペリエンスとセキュリティを向上させるために、新しいWindowsシステムにアップグレードすることをお勧めします。
 VSCODE拡張機能は悪意がありますか?
Apr 15, 2025 pm 07:57 PM
VSCODE拡張機能は悪意がありますか?
Apr 15, 2025 pm 07:57 PM
VSコード拡張機能は、悪意のあるコードの隠れ、脆弱性の活用、合法的な拡張機能としての自慰行為など、悪意のあるリスクを引き起こします。悪意のある拡張機能を識別する方法には、パブリッシャーのチェック、コメントの読み取り、コードのチェック、およびインストールに注意してください。セキュリティ対策には、セキュリティ認識、良好な習慣、定期的な更新、ウイルス対策ソフトウェアも含まれます。
 Python vs. JavaScript:学習曲線と使いやすさ
Apr 16, 2025 am 12:12 AM
Python vs. JavaScript:学習曲線と使いやすさ
Apr 16, 2025 am 12:12 AM
Pythonは、スムーズな学習曲線と簡潔な構文を備えた初心者により適しています。 JavaScriptは、急な学習曲線と柔軟な構文を備えたフロントエンド開発に適しています。 1。Python構文は直感的で、データサイエンスやバックエンド開発に適しています。 2。JavaScriptは柔軟で、フロントエンドおよびサーバー側のプログラミングで広く使用されています。
 PHPとPython:彼らの歴史を深く掘り下げます
Apr 18, 2025 am 12:25 AM
PHPとPython:彼らの歴史を深く掘り下げます
Apr 18, 2025 am 12:25 AM
PHPは1994年に発信され、Rasmuslerdorfによって開発されました。もともとはウェブサイトの訪問者を追跡するために使用され、サーバー側のスクリプト言語に徐々に進化し、Web開発で広く使用されていました。 Pythonは、1980年代後半にGuidovan Rossumによって開発され、1991年に最初にリリースされました。コードの読みやすさとシンプルさを強調し、科学的コンピューティング、データ分析、その他の分野に適しています。
 ターミナルVSCODEでプログラムを実行する方法
Apr 15, 2025 pm 06:42 PM
ターミナルVSCODEでプログラムを実行する方法
Apr 15, 2025 pm 06:42 PM
VSコードでは、次の手順を通じて端末でプログラムを実行できます。コードを準備し、統合端子を開き、コードディレクトリが端末作業ディレクトリと一致していることを確認します。プログラミング言語(pythonのpython your_file_name.pyなど)に従って実行コマンドを選択して、それが正常に実行されるかどうかを確認し、エラーを解決します。デバッガーを使用して、デバッグ効率を向上させます。
