vue を使用して縦棒グラフを実装する方法: 1. div 属性を "
"; として作成します。 2 "mounted(){this.fetchData()window.addEventListener('resize',()=>{if (this.chart){...}" を渡して 3 次元ヒストグラムを実装するだけです。

このチュートリアルの動作環境: Windows 10 システム、vue3 バージョン、DELL G3 コンピューター
vue を使用して縦棒グラフを実装するにはどうすればよいですか?
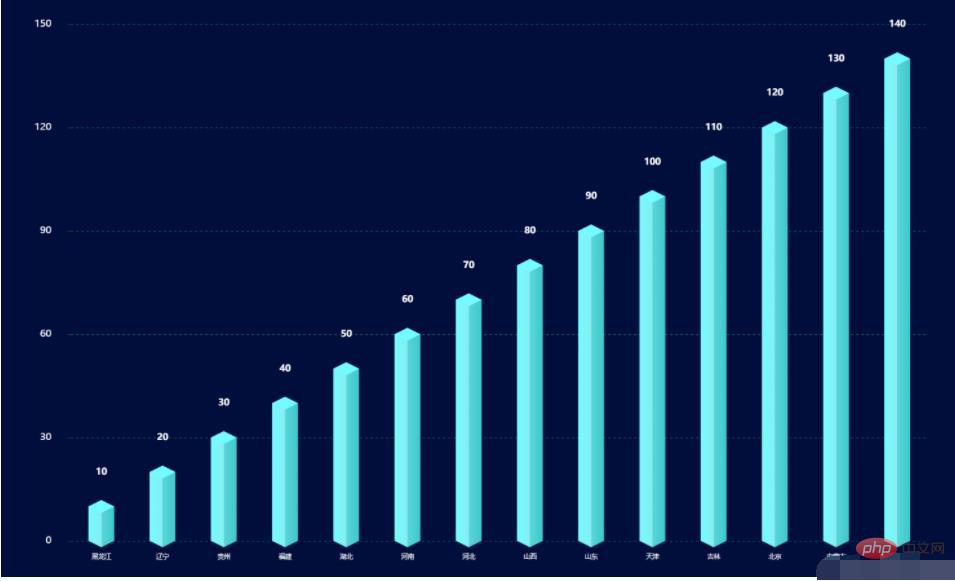
vue は 3 次元ヒストグラムを実装します
スタイルは次の図に示すとおりです:
三次元ヒストグラムは yData の底部と上部とみなすことができます。その構成、対応するコードは次のとおりです。
<template>
  <div></div></template>
<script>import echarts from 'echarts'export default {
data() {
return {
chart: null,
data: [], //数据
xData: [], //x轴
yBarData: [], //y轴
yLable: [],
colorStops: [],
chartLegend: [], //图例
colorOptions: [ //图例以及柱形图颜色选择
'#5ba2e4',
'#f58510',
'#afa5a5',
'#facb3d',
'#0854cf',
'#48c611',
'#082b63'
]
}
},
mounted() {
this.fetchData()
//图的大小自适应
window.addEventListener('resize',()=>{
if (this.chart){
this.chart.resize()
}
})
},
beforeDestroy() { //实例销毁之前调用
if (!this.chart) {
return
}
this.chart.dispose()
this.chart = null
},
methods: {
fetchData() {
this.xData = ["黑龙江",'辽宁','贵州','福建','湖北','河南','河北','山西','山东','天津','吉林','北京','内蒙古','云南']
this.yLable = ['10','20','30','40','50','60','70','80','90','100','110','120','130','140']
this.chartLegend = []
const dateArr = []
this.yLable.forEach((item, index) => {
if (item !== null && item !== undefined) {
dateArr.push(this.yLable[index])
}
})
this.chartLegend = dateArr this.initData()
this.initChart()
},
initData() {
this.yBarData = this.yLable },
initChart() {
this.chart = echarts.init(this.$refs.BarChart)
this.chart.clear() // 清空当前实例
let colors = []
const dom = 800
const barWidth = dom / 20
for (let i = 0; i < 4; i++) {
colors.push({
colorStops: [
{
offset: 0,
color: '#73fcff' // 最左边
}, {
offset: 0.5,
color: '#86eef1' // 左边的右边 颜色
}, {
offset: 0.5,
color: '#5ad6d9' // 右边的左边 颜色
}, {
offset: 1,
color: '#3dc8ca'
}]
})
}
this.chart.setOption({
backgroundColor: '#010d3a',
//提示框
tooltip: {
trigger: 'axis',
formatter: "{b} : {c}",
axisPointer: { // 坐标轴指示器,坐标轴触发有效
type: 'shadow' // 默认为直线,可选为:'line' | 'shadow'
}
},
/**区域位置*/
grid: {
left: '10%',
right: '10%',
top: '10%',
bottom: '10%',
},
//X轴
xAxis: [{
data: this.xData,
type: 'category',
show: true,
axisLine: {
show: false,
lineStyle: {
color: 'rgba(255,255,255,1)',
shadowColor: 'rgba(255,255,255,1)',
// shadowOffsetX: '20'
},
symbol: ['none', 'arrow'],
symbolOffset: [0, 25]
},
splitLine: {
show: false
},
axisTick: {
show: false
},
axisLabel: {
margin: 20,
fontSize: 10
}
}],
yAxis: {
show: true,
splitNumber: 4,
axisLine: {
show: false
},
splitLine: {
show: true,
lineStyle: {
type: 'dashed',
color: '#075858'
},
},
axisLabel: {
show: true,
color: '#FFFFFF',
margin: 30,
fontSize: 15
}
},
series: [
{//数据颜色
name: '日付费用户数',
type: 'bar',
barWidth: barWidth,
itemStyle: {
normal: {
color: (params) => {
return colors[params.dataIndex % 4];
}
}
},
label: {
show: true,
position: [barWidth / 2, -(barWidth + 20)],
color: '#ffffff',
fontSize: 14,
fontStyle: 'bold',
align: 'center'
},
data: this.yBarData },
{//底
z: 2,
type: 'pictorialBar',
data: this.yBarData,
symbol: 'diamond',
symbolOffset: [0, '50%'],
symbolSize: [barWidth, barWidth * 0.5],
itemStyle: {
normal: {
color: (params) => {
return colors[params.dataIndex % 4]
}
}
}
},
{//顶
z: 3,
type: 'pictorialBar',
symbolPosition: 'end',
data: this.yBarData,
symbol: 'diamond',
symbolOffset: [0, '-50%'],
symbolSize: [barWidth, barWidth * 0.5],
itemStyle: {
normal: {
borderWidth: 0,
color: (params) => {
return colors[params.dataIndex % 4].colorStops[0].color;
}
}
}
}
]
}, true)
}
}}</script>上記の JS コードでは、次の注意事項があります。
colors[params.dataIndex % 4]#this.colorOptions[params.dataIndex % 4] に置き換えることができます。つまり、colorOptions を使用します。カラー塗りつぶしのコードで定義されています
の 4 の選択は可変です, インデックス値が色変数の長さの範囲内にあることを確認します。例: この例では、色の長さは 4, params. dataIndex % 4can be not more than 4 <template> <bar-chart></bar-chart></template>
<script>import barChart from "./components/barChart"export default {
name: 'barchart',
components: { barChart }}</script>vue ビデオ チュートリアル》
以上がvue を使用して縦棒グラフを実装する方法の詳細内容です。詳細については、PHP 中国語 Web サイトの他の関連記事を参照してください。