Python の 10 のヒントで、データ分析のニーズの 90% がカバーされます。
データ アナリストの日常業務には、データの前処理、データ分析、機械学習モデルの作成、モデルのデプロイなど、さまざまなタスクが含まれます。
この記事では、データ分析の問題の 90% をカバーできる 10 の Python 操作を紹介します。いいね、お気に入り、注目を集めましょう。
1. データ セットの読み取り
データの読み取りはデータ分析に不可欠な部分であり、さまざまなファイル形式からデータを読み取る方法を理解することがデータ アナリストの第一歩です。ここでは、pandas を使用して Covid-19 データを含む csv ファイルを読み取る方法の例を示します。
import pandas as pd
# reading the countries_data file along with the location within read_csv function.
countries_df = pd.read_csv('C:/Users/anmol/Desktop/Courses/Python for Data Science/Code/countries_data.csv')
# showing the first 5 rows of the dataframe
countries_df.head()
以下は、countries_df.head() の出力です。これを使用して、データ フレームの最初の 5 行を表示できます:

2 . 概要統計
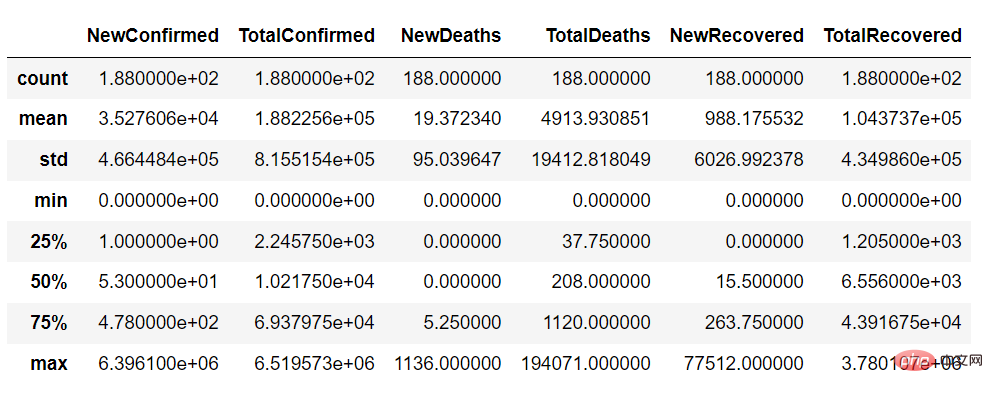
次のステップは、Newconfirmed や Totalconfirmed などの数値列の数、平均、標準偏差、分位数、頻度と最高値などのデータ概要を確認してデータを理解することです。国コードなどのカテゴリ列の出現値
<span style="color: rgb(89, 89, 89); margin: 0px; padding: 0px; background: none 0% 0% / auto repeat scroll padding-box border-box rgba(0, 0, 0, 0);">countries_df</span>.<span style="color: rgb(0, 92, 197); margin: 0px; padding: 0px; background: none 0% 0% / auto repeat scroll padding-box border-box rgba(0, 0, 0, 0);">describe</span>()
describe 関数を使用すると、次のようにデータ セットの連続変数の概要を取得できます。
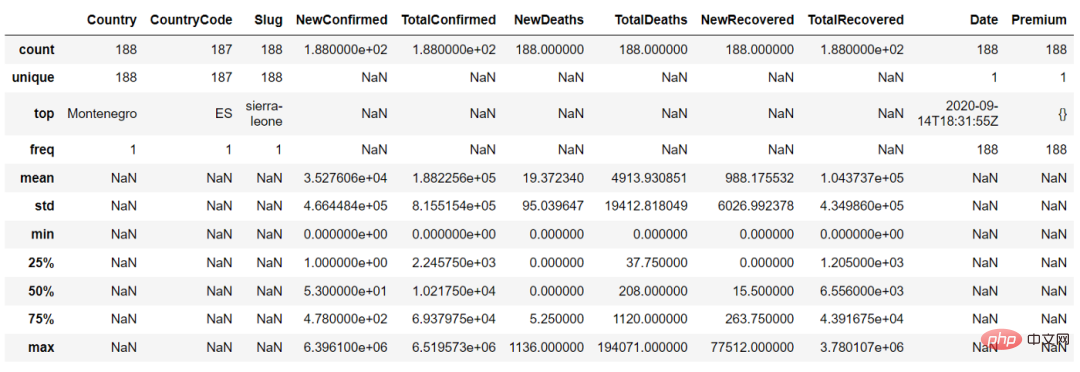
describe() 関数で、パラメータ「include = 'all'」を設定すると、連続変数とカテゴリ変数の概要を取得できますcountries_df.describe(include = 'all')
 3。データの選択とフィルタリング
 分析では実際にはすべての行とデータセット列の合計は必要ありません。関心のある列を選択し、質問に基づいて一部の行をフィルタリングするだけです。
たとえば、次のコードを使用して Country 列と Newconfirmed 列を選択できます:
countries_df[['Country','NewConfirmed']]
データ Country をフィルターすることもできます。loc を使用すると、いくつかの値に基づいて列をフィルターできます。
countries_df.loc[countries_df['Country'] == 'United States of America']
 カウント、合計、平均などのデータ集計は、最も一般的に実行されるタスクの 1 つです。データ分析において。
集計を使用して、国ごとの NewConfimed ケースの合計数を見つけることができます。集計を実行するには、groupby 関数と agg 関数を使用します。
countries_df.groupby(['Country']).agg({'NewConfirmed':'sum'})5, Join
結合操作を使用して、2 つのデータ セットを 1 つのデータ セットに結合します。
例: あるデータセットにはさまざまな国の Covid-19 症例数が含まれ、別のデータセットにはさまざまな国の緯度と経度の情報が含まれる場合があります。
ここで、これら 2 つの情報を組み合わせる必要があり、次に示すように接続操作を実行できます
countries_lat_lon = pd.read_excel('C:/Users/anmol/Desktop/Courses/Python for Data Science/Code/countries_lat_lon.xlsx')

# joining the 2 dataframe : countries_df and countries_lat_lon
# syntax : pd.merge(left_df, right_df, on = 'on_column', how = 'type_of_join')
joined_df = pd.merge(countries_df, countries_lat_lon, on = 'CountryCode', how = 'inner')
joined_df6. 組み込み関数
数学的な組み込み関数を理解するmin()、max()、mean()、sum() などの関数は、さまざまな分析を実行するのに非常に役立ちます。
これらの関数を呼び出すことで、データ フレームに直接適用できます。これらの関数は、以下に示すように、列または集計関数で独立して使用できます:
# finding sum of NewConfirmed cases of all the countries
countries_df['NewConfirmed'].sum()
# Output : 6,631,899

# finding the sum of NewConfirmed cases across different countries
countries_df.groupby(['Country']).agg({'NewConfirmed':'sum'})

# Output
#NewConfirmed
#Country
#Afghanistan75
#Albania 168
#Algeria 247
#Andorra0
#Angola537. ユーザー定義関数
私たち自身が作成する関数はユーザー定義関数です。必要に応じて関数を呼び出すことで、これらの関数のコードを実行できます。たとえば、次のように 2 つの数値を加算する関数を作成できます:
# User defined function is created using 'def' keyword, followed by function definition - 'addition()'
# and 2 arguments num1 and num2
def addition(num1, num2):
return num1+num2

# calling the function using function name and providing the arguments
print(addition(1,2))
#output : 3
8, Pivot
Pivot は、列行内の一意の値を複数の新しい列に変換することです。優れたデータ処理技術です。
Covid-19 データセットで pivot_table() 関数を使用すると、国名を別の新しい列 (
# using pivot_table to convert values within the Country column into individual columns and
# filling the values corresponding to these columns with numeric variable - NewConfimed
pivot_df = pd.pivot_table(countries_df,columns = 'Country', values = 'NewConfirmed')
pivot_df
9) に変換できます。データ フレームを反復処理します。
データ フレームのインデックスと行を走査する必要がある場合、関数 iterrows を使用してデータ フレームを走査できます:
# iterating over the index and row of a dataframe using iterrows() function
for index, row in countries_df.iterrows():
print('Index is ' + str(index))
print('Country is '+ str(row['Country']))

# Output :
# Index is 0
# Country is Afghanistan
# Index is 1
# Country is Albania
# .......10. 文字列操作
文字列列を処理する回数が多いデータセット内 (ここ) この場合、いくつかの基本的な文字列操作を理解することが重要です。
たとえば、文字列を大文字、小文字に変換する方法や、文字列の長さを調べる方法などです。
rree以上がPython の 10 のヒントで、データ分析のニーズの 90% がカバーされます。の詳細内容です。詳細については、PHP 中国語 Web サイトの他の関連記事を参照してください。

ホットAIツール

Undresser.AI Undress
リアルなヌード写真を作成する AI 搭載アプリ

AI Clothes Remover
写真から衣服を削除するオンライン AI ツール。

Undress AI Tool
脱衣画像を無料で

Clothoff.io
AI衣類リムーバー

AI Hentai Generator
AIヘンタイを無料で生成します。

人気の記事

ホットツール

メモ帳++7.3.1
使いやすく無料のコードエディター

SublimeText3 中国語版
中国語版、とても使いやすい

ゼンドスタジオ 13.0.1
強力な PHP 統合開発環境

ドリームウィーバー CS6
ビジュアル Web 開発ツール

SublimeText3 Mac版
神レベルのコード編集ソフト(SublimeText3)

ホットトピック
 7554
7554
 15
15
 1382
1382
 52
52
 83
83
 11
11
 24
24
 96
96
 PHPおよびPython:コードの例と比較
Apr 15, 2025 am 12:07 AM
PHPとPythonには独自の利点と短所があり、選択はプロジェクトのニーズと個人的な好みに依存します。 1.PHPは、大規模なWebアプリケーションの迅速な開発とメンテナンスに適しています。 2。Pythonは、データサイエンスと機械学習の分野を支配しています。
 Python vs. JavaScript:コミュニティ、ライブラリ、リソース
Apr 15, 2025 am 12:16 AM
PythonとJavaScriptには、コミュニティ、ライブラリ、リソースの観点から、独自の利点と短所があります。 1)Pythonコミュニティはフレンドリーで初心者に適していますが、フロントエンドの開発リソースはJavaScriptほど豊富ではありません。 2)Pythonはデータサイエンスおよび機械学習ライブラリで強力ですが、JavaScriptはフロントエンド開発ライブラリとフレームワークで優れています。 3)どちらも豊富な学習リソースを持っていますが、Pythonは公式文書から始めるのに適していますが、JavaScriptはMDNWebDocsにより優れています。選択は、プロジェクトのニーズと個人的な関心に基づいている必要があります。
 CentosのPytorchのGPUサポートはどのようにサポートされていますか
Apr 14, 2025 pm 06:48 PM
Pytorch GPUアクセラレーションを有効にすることで、CentOSシステムでは、PytorchのCUDA、CUDNN、およびGPUバージョンのインストールが必要です。次の手順では、プロセスをガイドします。CUDAおよびCUDNNのインストールでは、CUDAバージョンの互換性が決定されます。NVIDIA-SMIコマンドを使用して、NVIDIAグラフィックスカードでサポートされているCUDAバージョンを表示します。たとえば、MX450グラフィックカードはCUDA11.1以上をサポートする場合があります。 cudatoolkitのダウンロードとインストール:nvidiacudatoolkitの公式Webサイトにアクセスし、グラフィックカードでサポートされている最高のCUDAバージョンに従って、対応するバージョンをダウンロードしてインストールします。 cudnnライブラリをインストールする:
 Dockerの原則の詳細な説明
Apr 14, 2025 pm 11:57 PM
DockerはLinuxカーネル機能を使用して、効率的で孤立したアプリケーションランニング環境を提供します。その作業原則は次のとおりです。1。ミラーは、アプリケーションを実行するために必要なすべてを含む読み取り専用テンプレートとして使用されます。 2。ユニオンファイルシステム(UnionFS)は、違いを保存するだけで、スペースを節約し、高速化する複数のファイルシステムをスタックします。 3.デーモンはミラーとコンテナを管理し、クライアントはそれらをインタラクションに使用します。 4。名前空間とcgroupsは、コンテナの分離とリソースの制限を実装します。 5.複数のネットワークモードは、コンテナの相互接続をサポートします。これらのコア概念を理解することによってのみ、Dockerをよりよく利用できます。
 ミニオペンCentosの互換性
Apr 14, 2025 pm 05:45 PM
MINIOオブジェクトストレージ:CENTOSシステムの下での高性能展開Minioは、Amazons3と互換性のあるGO言語に基づいて開発された高性能の分散オブジェクトストレージシステムです。 Java、Python、JavaScript、Goなど、さまざまなクライアント言語をサポートしています。この記事では、CentosシステムへのMinioのインストールと互換性を簡単に紹介します。 Centosバージョンの互換性Minioは、Centos7.9を含むがこれらに限定されない複数のCentosバージョンで検証されています。
 CentosでPytorchの分散トレーニングを操作する方法
Apr 14, 2025 pm 06:36 PM
Pytorchの分散トレーニングでは、Centosシステムでトレーニングには次の手順が必要です。Pytorchのインストール:PythonとPipがCentosシステムにインストールされていることです。 CUDAバージョンに応じて、Pytorchの公式Webサイトから適切なインストールコマンドを入手してください。 CPUのみのトレーニングには、次のコマンドを使用できます。PipinstalltorchtorchtorchvisionTorchaudioGPUサポートが必要な場合は、CUDAとCUDNNの対応するバージョンがインストールされ、インストールに対応するPytorchバージョンを使用してください。分散環境構成:分散トレーニングには、通常、複数のマシンまたは単一マシンの複数GPUが必要です。場所
 CentosでPytorchバージョンを選択する方法
Apr 14, 2025 pm 06:51 PM
PytorchをCentosシステムにインストールする場合、適切なバージョンを慎重に選択し、次の重要な要因を検討する必要があります。1。システム環境互換性:オペレーティングシステム:Centos7以上を使用することをお勧めします。 Cuda and Cudnn:PytorchバージョンとCudaバージョンは密接に関連しています。たとえば、pytorch1.9.0にはcuda11.1が必要ですが、pytorch2.0.1にはcuda11.3が必要です。 CUDNNバージョンは、CUDAバージョンとも一致する必要があります。 Pytorchバージョンを選択する前に、互換性のあるCUDAおよびCUDNNバージョンがインストールされていることを確認してください。 Pythonバージョン:Pytorch公式支店
 Python:自動化、スクリプト、およびタスク管理
Apr 16, 2025 am 12:14 AM
Pythonは、自動化、スクリプト、およびタスク管理に優れています。 1)自動化:OSやShutilなどの標準ライブラリを介してファイルバックアップが実現されます。 2)スクリプトの書き込み:Psutilライブラリを使用してシステムリソースを監視します。 3)タスク管理:スケジュールライブラリを使用してタスクをスケジュールします。 Pythonの使いやすさと豊富なライブラリサポートにより、これらの分野で優先ツールになります。


