
画像処理は、ソーシャル メディアや医療画像処理などのさまざまな分野に関与し、私たちの日常生活に不可欠な要素となっています。デジタル カメラや衛星写真や医療スキャンなどの他のソースから取得した画像には、ノイズを除去または強調するための前処理が必要な場合があります。周波数領域フィルタリングは、画像の鮮鋭化を強化しながらノイズを除去できるソリューションとして考えられます。
高速フーリエ変換 (FFT) は、画像を空間領域から周波数領域に変換する数学的手法であり、画像処理における周波数変換の重要なツールです。画像の周波数領域表現を活用することで、その周波数成分に基づいて画像を効果的に分析できるため、ノイズを除去するためのフィルタリング手順の適用が簡素化されます。この記事では、FFT シフトと逆 FFT シフトの使用を組み合わせた、FFT から逆 FFT への画像の周波数変換に含まれるさまざまな段階について説明します。
この記事では、openCV、Numpy、Matplotlib という 3 つの Python ライブラリを使用します。
import cv2
 import numpy as np
 from matplotlib import pyplot as plt
 img = cv2.imread('sample.png',0) # Using 0 to read image in grayscale mode
 plt.imshow(img, cmap='gray')#cmap is used to specify imshow that the image is in greyscale
 plt.xticks([]), plt.yticks([])# remove tick marks
 plt.show()
高速フーリエ変換 (FFT) は、画像を空間領域から周波数領域に変換できるようにする広く使用されている数学的手法であり、周波数変換の基本コンポーネントです。 FFT 解析を使用すると、画像の周期性を取得してさまざまな周波数成分に分割し、各画像のそれぞれの周波数成分の振幅と位相を表示する画像スペクトルを生成できます。
f = np.fft.fft2(img)#the image 'img' is passed to np.fft.fft2() to compute its 2D Discrete Fourier transform f
 mag = 20*np.log(np.abs(f))
 plt.imshow(mag, cmap = 'gray') #cmap='gray' parameter to indicate that the image should be displayed in grayscale.
 plt.title('Magnitude Spectrum')
 plt.xticks([]), plt.yticks([])
 plt.show()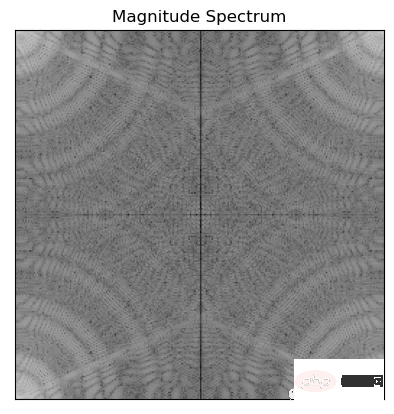
上記のコードは、np.abs() を使用してフーリエ変換 f の振幅を計算します。np.log( ) 対数スケールに変換し、20 を乗じて振幅をデシベル単位で取得します。これは、振幅スペクトルの視覚化と解釈を容易にするために行われます。
フィルター アルゴリズムを画像に適用するには、FFT シフトを使用して画像のゼロ周波数成分をスペクトルの中心に移動します
fshift = np.fft.fftshift(f)
 mag = 20*np.log(np.abs(fshift))
 plt.imshow(mag, cmap = 'gray')
 plt.title('Centered Spectrum'), plt.xticks([]), plt.yticks([])
 plt.show()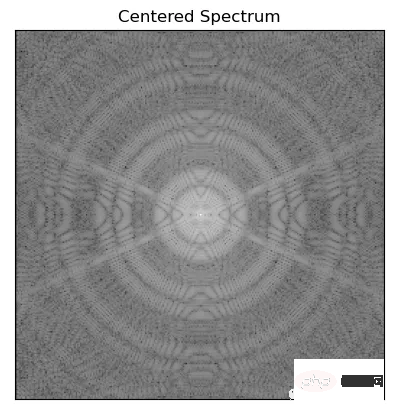
import math
 def distance(point1,point2):
 return math.sqrt((point1[0]-point2[0])**2 + (point1[1]-point2[1])**2)

 def idealFilterLP(D0,imgShape):
 base = np.zeros(imgShape[:2])
 rows, cols = imgShape[:2]
 center = (rows/2,cols/2)
 for x in range(cols):
 for y in range(rows):
 if distance((y,x),center) < D0:
 base[y,x] = 1
 return base

 def idealFilterHP(D0,imgShape):
 base = np.ones(imgShape[:2])
 rows, cols = imgShape[:2]
 center = (rows/2,cols/2)
 for x in range(cols):
 for y in range(rows):
 if distance((y,x),center) < D0:
 base[y,x] = 0
 return base
次の関数は、必要な円形マスクを使用してガウス ハイパス フィルターとローパス フィルターを生成します
import math
 def distance(point1,point2):
 return math.sqrt((point1[0]-point2[0])**2 + (point1[1]-point2[1])**2)

 def gaussianLP(D0,imgShape):
 base = np.zeros(imgShape[:2])
 rows, cols = imgShape[:2]
 center = (rows/2,cols/2)
 for x in range(cols):
 for y in range(rows):
 base[y,x] = math.exp(((-distance((y,x),center)**2)/(2*(D0**2))))
 return base

 def gaussianHP(D0,imgShape):
 base = np.zeros(imgShape[:2])
 rows, cols = imgShape[:2]
 center = (rows/2,cols/2)
 for x in range(cols):
 for y in range(rows):
 base[y,x] = 1 - math.exp(((-distance((y,x),center)**2)/(2*(D0**2))))
 return base
フィルタリングの例
fig, ax = plt.subplots(2, 2) # create a 2x2 grid of subplots
 fig.suptitle('Filters') # set the title for the entire figure

 # plot the first image in the top-left subplot
 im1 = ax[0, 0].imshow(np.abs(idealFilterLP(50, img.shape)), cmap='gray')
 ax[0, 0].set_title('Low Pass Filter of Diameter 50 px')
 ax[0, 0].set_xticks([])
 ax[0, 0].set_yticks([])

 # plot the second image in the top-right subplot
 im2 = ax[0, 1].imshow(np.abs(idealFilterHP(50, img.shape)), cmap='gray')
 ax[0, 1].set_title('High Pass Filter of Diameter 50 px')
 ax[0, 1].set_xticks([])
 ax[0, 1].set_yticks([])

 # plot the third image in the bottom-left subplot
 im3 = ax[1, 0].imshow(np.abs(gaussianLP(50 ,img.shape)), cmap='gray')
 ax[1, 0].set_title('Gaussian Filter of Diameter 50 px')
 ax[1, 0].set_xticks([])
 ax[1, 0].set_yticks([])

 # plot the fourth image in the bottom-right subplot
 im4 = ax[1, 1].imshow(np.abs(gaussianHP(50 ,img.shape)), cmap='gray')
 ax[1, 1].set_title('Gaussian Filter of Diameter 50 px')
 ax[1, 1].set_xticks([])
 ax[1, 1].set_yticks([])

 # adjust the spacing between subplots
 fig.subplots_adjust(wspace=0.5, hspace=0.5)

 # save the figure to a file
 fig.savefig('filters.png', bbox_inches='tight')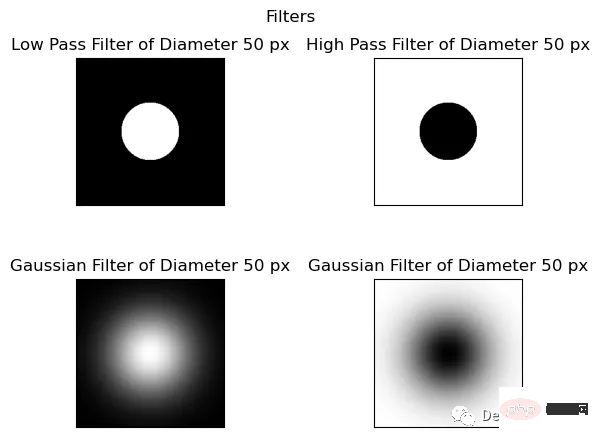
相乘过滤器和移位的图像得到过滤图像
为了获得具有所需频率响应的最终滤波图像,关键是在频域中对移位后的图像与滤波器进行逐点乘法。
这个过程将两个图像元素的对应像素相乘。例如,当应用低通滤波器时,我们将对移位的傅里叶变换图像与低通滤波器逐点相乘。
此操作抑制高频并保留低频,对于高通滤波器反之亦然。这个乘法过程对于去除不需要的频率和增强所需的频率是必不可少的,从而产生更清晰和更清晰的图像。
它使我们能够获得期望的频率响应,并在频域获得最终滤波图像。
乘法滤波器是一种以像素值为权重的滤波器,它通过将滤波器的权重与图像的像素值相乘,来获得滤波后的像素值。具体地,假设乘法滤波器的权重为h(i,j),图像的像素值为f(m,n),那么滤波后的像素值g(x,y)可以表示为:
g(x,y) = ∑∑ f(m,n)h(x-m,y-n)
其中,∑∑表示对所有的(m,n)进行求和。
平移后的图像是指将图像进行平移操作后的结果。平移操作通常是指将图像的像素沿着x轴和y轴方向进行平移。平移后的图像与原始图像具有相同的大小和分辨率,但它们的像素位置发生了变化。在滤波操作中,平移后的图像可以用于与滤波器进行卷积运算,以实现滤波操作。
此操作抑制高频并保留低频,对于高通滤波器反之亦然。这个乘法过程对于去除不需要的频率和增强所需的频率是必不可少的,从而产生更清晰和更清晰的图像。
它使我们能够获得期望的频率响应,并在频域获得最终滤波图像。
fig, ax = plt.subplots()
 im = ax.imshow(np.log(1+np.abs(fftshifted_image * idealFilterLP(50,img.shape))), cmap='gray')
 ax.set_title('Filtered Image in Frequency Domain')
 ax.set_xticks([])
 ax.set_yticks([])

 fig.savefig('filtered image in freq domain.png', bbox_inches='tight')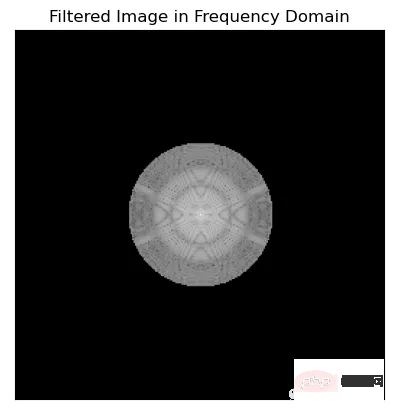
在可视化傅里叶频谱时,使用np.log(1+np.abs(x))和20*np.log(np.abs(x))之间的选择是个人喜好的问题,可以取决于具体的应用程序。
一般情况下会使用Np.log (1+np.abs(x)),因为它通过压缩数据的动态范围来帮助更清晰地可视化频谱。这是通过取数据绝对值的对数来实现的,并加上1以避免取零的对数。
而20*np.log(np.abs(x))将数据按20倍缩放,并对数据的绝对值取对数,这可以更容易地看到不同频率之间较小的幅度差异。但是它不会像np.log(1+np.abs(x))那样压缩数据的动态范围。
这两种方法都有各自的优点和缺点,最终取决于具体的应用程序和个人偏好。
在频域滤波后,我们需要将图像移回原始位置,然后应用逆FFT。为了实现这一点,需要使用逆FFT移位,它反转了前面执行的移位过程。
fig, ax = plt.subplots()
 im = ax.imshow(np.log(1+np.abs(np.fft.ifftshift(fftshifted_image * idealFilterLP(50,img.shape)))), cmap='gray')
 ax.set_title('Filtered Image inverse fft shifted')
 ax.set_xticks([])
 ax.set_yticks([])

 fig.savefig('filtered image inverse fft shifted.png', bbox_inches='tight')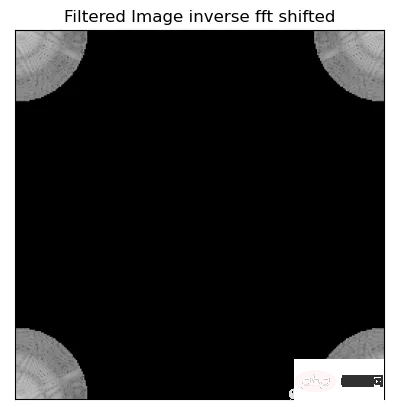
快速傅里叶逆变换(IFFT)是图像频率变换的最后一步。它用于将图像从频域传输回空间域。这一步的结果是在空间域中与原始图像相比,图像减少了噪声并提高了清晰度。
fig, ax = plt.subplots()
 im = ax.imshow(np.log(1+np.abs(np.fft.ifft2(np.fft.ifftshift(fftshifted_image * idealFilterLP(50,img.shape))))), cmap='gray')
 ax.set_title('Final Filtered Image In Spatial Domain')
 ax.set_xticks([])
 ax.set_yticks([])

 fig.savefig('final filtered image.png', bbox_inches='tight')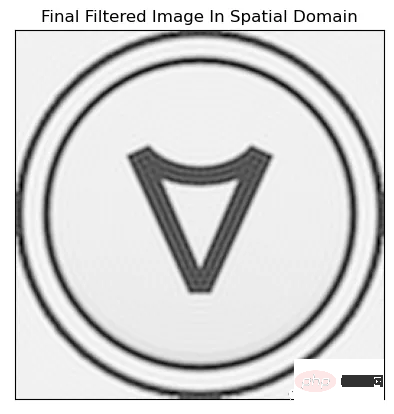
我们再把所有的操作串在一起显示,
函数绘制所有图像
def Freq_Trans(image, filter_used):
 img_in_freq_domain = np.fft.fft2(image)

 # Shift the zero-frequency component to the center of the frequency spectrum
 centered = np.fft.fftshift(img_in_freq_domain)

 # Multiply the filter with the centered spectrum
 filtered_image_in_freq_domain = centered * filter_used

 # Shift the zero-frequency component back to the top-left corner of the frequency spectrum
 inverse_fftshift_on_filtered_image = np.fft.ifftshift(filtered_image_in_freq_domain)

 # Apply the inverse Fourier transform to obtain the final filtered image
 final_filtered_image = np.fft.ifft2(inverse_fftshift_on_filtered_image)

 return img_in_freq_domain,centered,filter_used,filtered_image_in_freq_domain,inverse_fftshift_on_filtered_image,final_filtered_image
使用高通、低通理想滤波器和高斯滤波器的直径分别为50、100和150像素,展示它们对增强图像清晰度的影响。
fig, axs = plt.subplots(12, 7, figsize=(30, 60))

 filters = [(f, d) for f in [idealFilterLP, idealFilterHP, gaussianLP, gaussianHP] for d in [50, 100, 150]]

 for row, (filter_name, filter_diameter) in enumerate(filters):
 # Plot each filter output on a separate subplot
 result = Freq_Trans(img, filter_name(filter_diameter, img.shape))

 for col, title, img_array in zip(range(7),
["Original Image", "Spectrum", "Centered Spectrum", f"{filter_name.__name__} of Diameter {filter_diameter} px",
 f"Centered Spectrum multiplied by {filter_name.__name__}", "Decentralize", "Processed Image"],
[img, np.log(1+np.abs(result[0])), np.log(1+np.abs(result[1])), np.abs(result[2]), np.log(1+np.abs(result[3])),
np.log(1+np.abs(result[4])), np.abs(result[5])]):

 axs[row, col].imshow(img_array, cmap='gray')
 axs[row, col].set_title(title)

 plt.tight_layout()
 plt.savefig('all_processess.png', bbox_inches='tight')
 plt.show()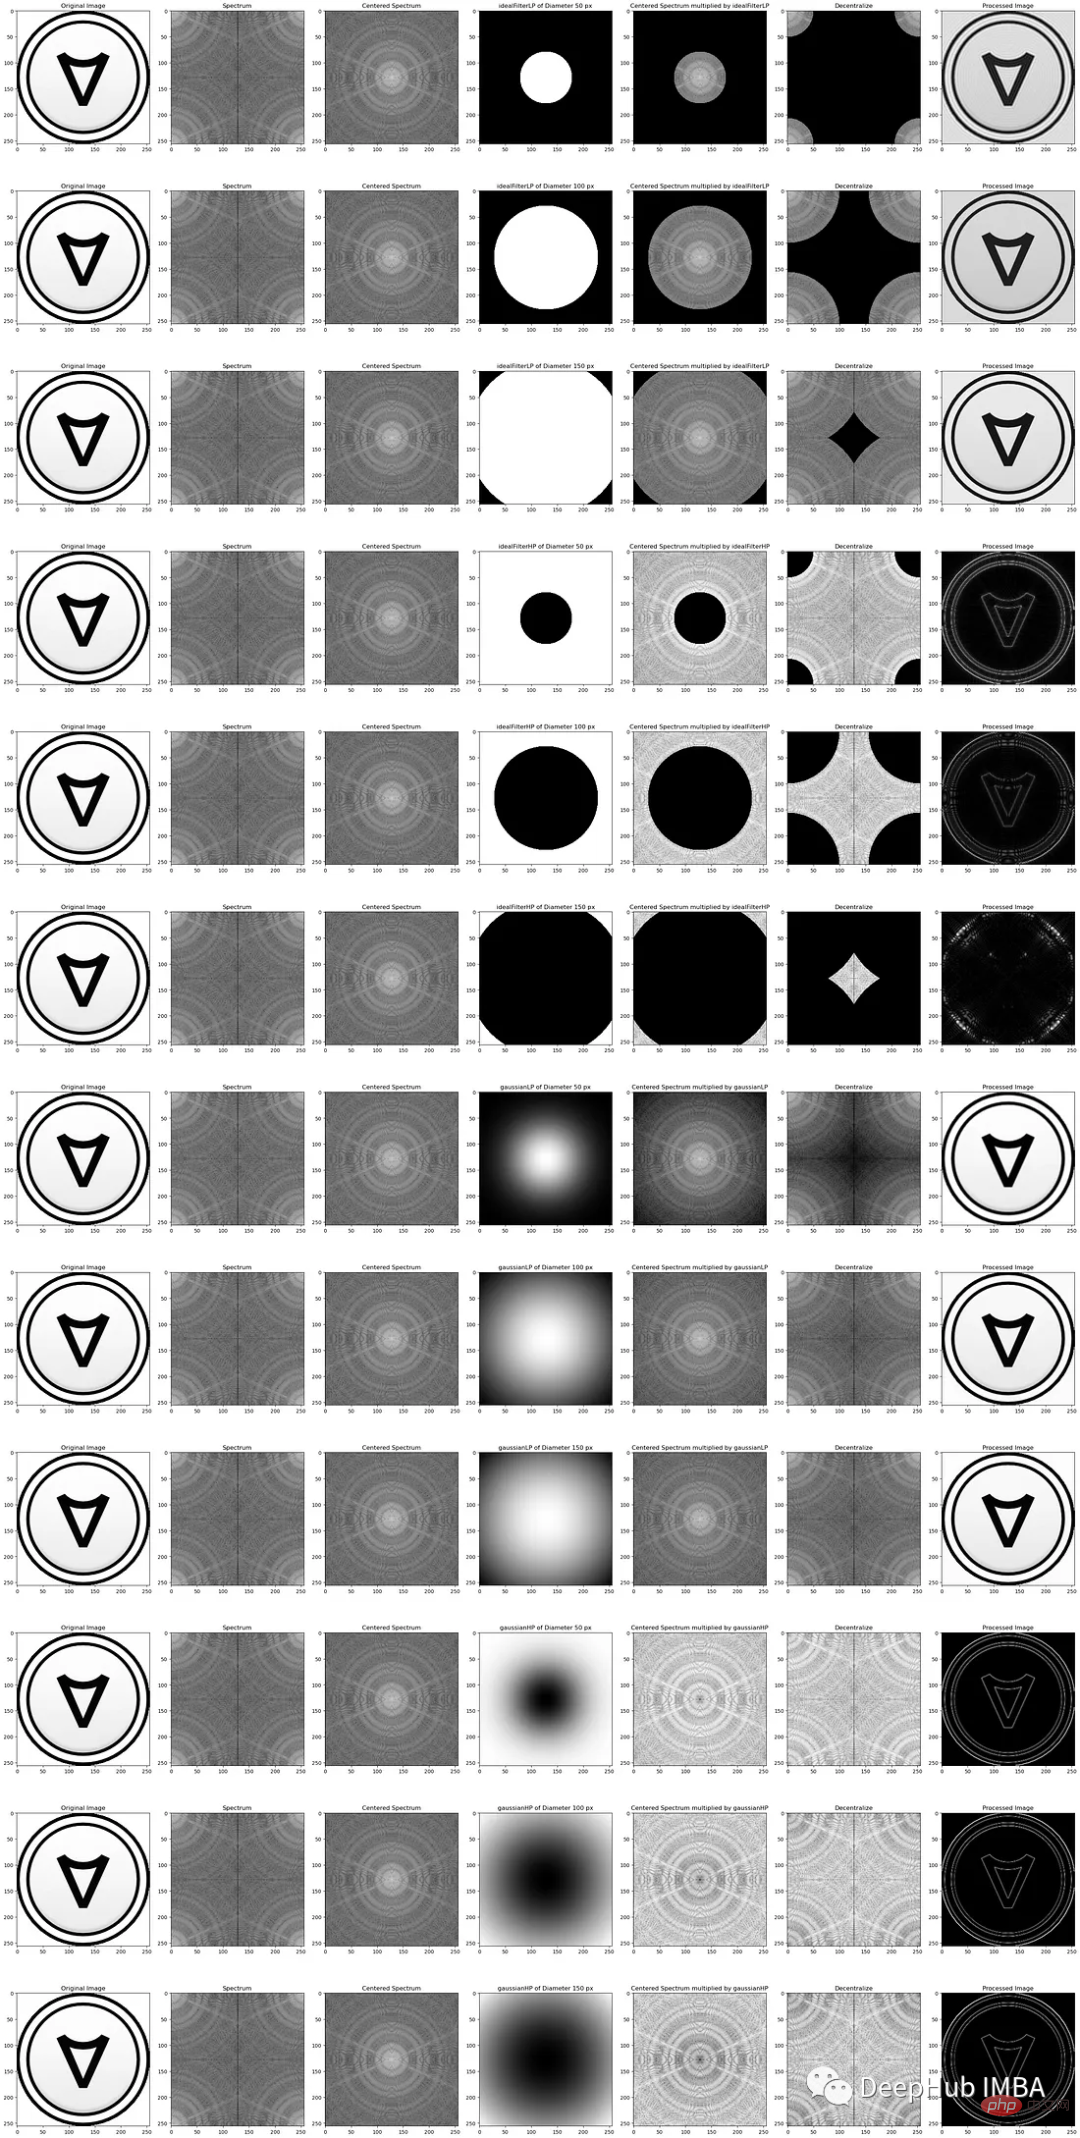
円形マスクの直径を変更すると、画像の鮮明さへの影響が異なることがわかります。直径が大きくなると、より多くの周波数が抑制され、その結果、ディテールが少なく滑らかな画像が得られます。直径を小さくすると、より多くの周波数が通過できるようになり、より鮮明な画像とより詳細な画像が得られます。望ましい効果を達成するには、適切な直径を選択することが重要です。直径が小さすぎるとフィルターの効果が不十分になり、直径が大きすぎると詳細が過剰になります。迷っていること。
一般に、ガウス フィルターはその滑らかさと堅牢性により、画像処理タスクでより一般的に使用されます。より鋭いカットオフが必要な一部のアプリケーションでは、理想的なフィルターの方が適している場合があります。
FFT を使用して画像周波数を変更することは、ノイズを低減し、画像の鮮明さを向上させる効果的な方法です。これには、FFT を使用して画像を周波数領域に変換し、適切な技術を使用してノイズをフィルタリングし、逆 FFT を使用して変更された画像を空間領域に変換することが含まれます。これらの技術を理解して実装することで、さまざまなアプリケーションの画質を向上させることができます。
以上がPython 画像処理: 周波数領域フィルタリング、ノイズ低減、画像強調の詳細内容です。詳細については、PHP 中国語 Web サイトの他の関連記事を参照してください。