Detailed explanation of JAVA virtual machine (JVM) (2) - memory division
We know that in C language, if you want to use an object, you need to perform a new operation on it; if you no longer use the object, you need to perform a delete operation on it. Once the developer forgets to write the delete statement, it will cause a memory leak. [If memory is occupied by an object and is not returned, it is called a memory leak. 】
But Java is smart. It has evolved from "manual" to "automatic" and handed over the control of memory to the virtual machine. Let's take a peek at how jvm performs automatic memory management.

Automatic memory management is divided into two parts:
Allocate memory to objects and reclaim memory allocated to objects. In this article we talk about the former, which is memory partitioning and memory allocation. Let’s talk about GC (garbage collection) in the next article.
1. Memory division
Let’s take a look at what is in the virtual machine memory. The memory area of the JVM is roughly divided into Class files, class loading subsystem, runtime data area, and execution engine. Today we only talk about the runtime data area. [This picture is based on JDK7. Before JDK7, the constant pool was stored in the method area. Since JDK7, the constant pool has been placed on the heap. 】
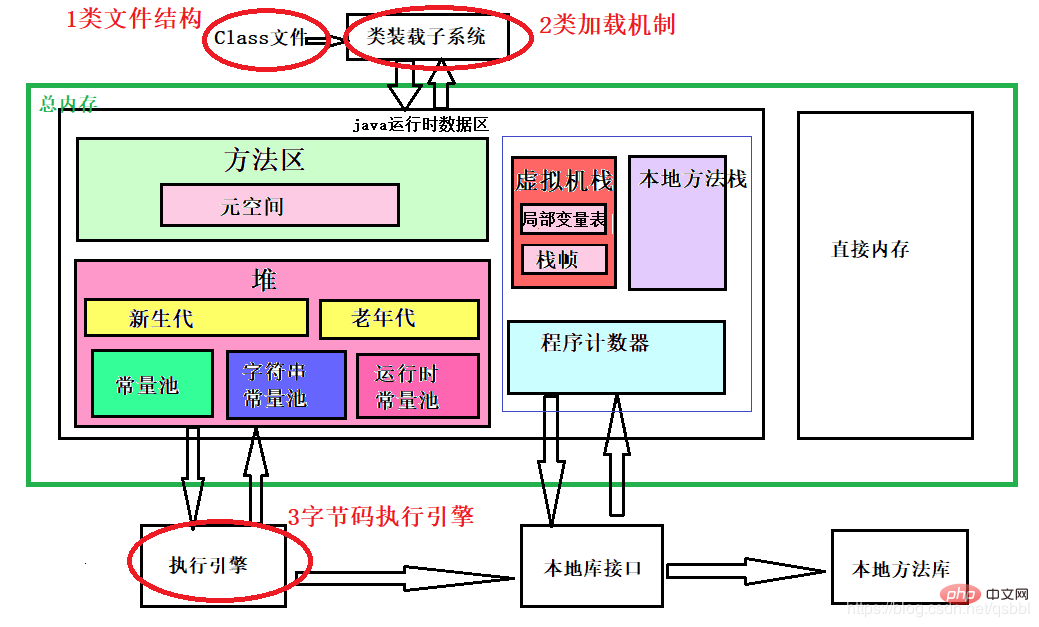
Thread public
In the runtime data area, the method area and heap are public to the thread, that is, this The two areas are "recycled", so they need to be garbage collected. It is created when the virtual machine starts.
Thread private
The virtual machine stack, local method stack, and program counter are private to the thread. They "live and die" with the thread and are "one-time" , so there is no need to garbage collect it.
(1) Method area
stores class information, constants, static variables, code compiled by the just-in-time compiler and other data that have been loaded by the virtual machine .
There is a runtime constant pool. What it stores is the symbol reference described in the Class file, a direct reference. New constants can be put into this pool at both compile time and run time.
(2) Heap
Concept: If the stack solves the problem of program operation, that is, how the program processes data; then the heap solves It is a data storage problem, that is, how and where to put the data.
Features:
a. The heap is the largest piece of virtual machine memory, accounting for about three-quarters of the memory. For example, if each process on a 32-bit Windows platform has 2GB of memory, 1.5GB of memory is generally allocated to the heap. It can be seen that the heap takes up a lot of space.
b. It can be in physically discontinuous memory space, as long as it is logically continuous.
Function:
Storage object instances, almost all object instances allocate memory here.
Classification:
From the perspective of memory recycling, it is divided into the new generation and the old generation.
From the perspective of memory allocation, multiple thread-private allocation buffers can be divided.
(3) Virtual machine stack
#The virtual machine stack stores stack frames, and the stack frames store local variable tables. Operand stack, dynamic link, method exit and other information.
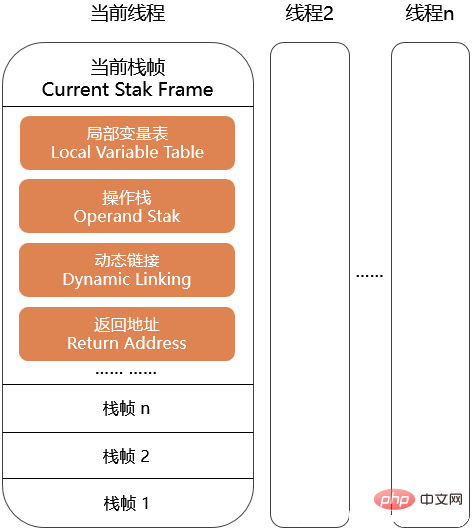
Stack frame in the stack
Each method will create a stack frame and a method while executing The process from call to completion of execution corresponds to the process from pushing a stack frame into the virtual machine stack to popping it out.
The local variable table in the stack frame
stores various basic data types, object references, and returnAddress types that are known at compile time. Therefore, the memory space required can be allocated during compilation, and its size will not change during runtime.
When allocating the space occupied by basic data types, except for 64-bit long and double type data, which will occupy two local variable spaces, the other data types only occupy one.
(4) Local method stack
The local method stack and the virtual machine stack have the same function, except that the virtual machine stack executes java methods , the native method stack executes the Native method.
The java method is the java code written by the developer, and the Native method is an interface for java to call non-java code.
(5) Program counter
The program counter stores the line number of the bytecode executed by the current thread. When the jvm works, it selects the next bytecode instruction that needs to be executed by changing the value of this counter.
2. Memory allocation
#In this part we talk about how objects are allocated, laid out and accessed in the java heap. And the principles of memory allocation.
Creation of objects
We use new to create objects, let’s see what the virtual machine is doing when the system runs to new . At this time, humans are like a piece of meat. They have to go through layers of security checks before they can reach the human dinner table. Step 1: Check whether there is a corresponding symbol reference in the constant pool. [Proceed in the method area]
Step 2: Check whether this class has been loaded, parsed and initialized. [Proceed in the method area]
Step 3: Receive the memory of the new object. There are two ways: pointer collision and free list. [Proceed in the heap]
Step 4: Initialize the allocated memory space to zero value.
Step 5: Make necessary settings for the object, such as which class it is an instance of, the hash code of the object, etc. This information is stored in the object header of the object
Step 6: If the object is assigned an initial value in the java code, step 6 will be performed: execute the
Memory layout of objects
The storage layout of objects in memory is divided into 3 Part: Object header instance data alignment and filling
Object header
There are two parts of information in the object header:
(1) Runtime data, including Hash code, GC generation age, lock status flag, etc.
(2) Type pointer, the virtual machine uses this pointer to determine which class this object is an instance of.
Instance data
Instance data stores the contents of various types of fields defined in the code.
Alignment padding
Alignment padding functions as a placeholder and does not necessarily exist. It only needs to ensure that the size of the object is an integer multiple of 8 bytes.
Object access location
After creating the object, we can use the object. When using it, how can you find the object you are looking for? There are two ways: handle and direct pointer
Handle:
Handle access is to divide a piece of memory in the java heap As a handle pool, the handle contains the specific address information of object instance data and type data.
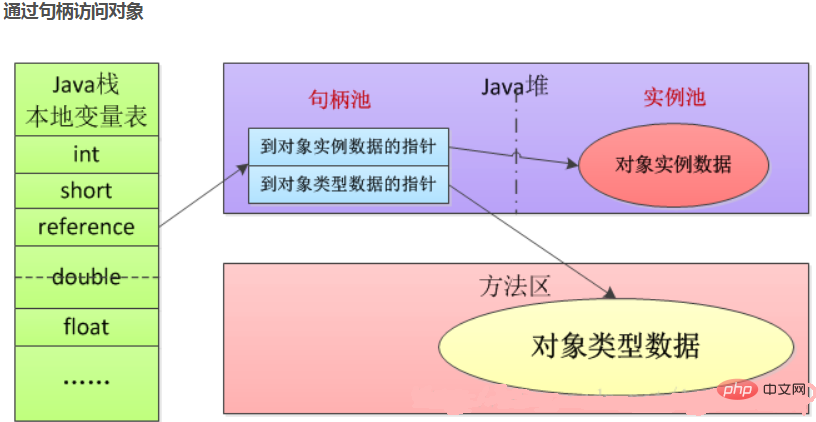
Direct pointer:
The reason why direct pointer is "direct" is It's because it removes the intermediary of the handle. So it is faster than handle. In the HotSpot virtual machine, this method is used.
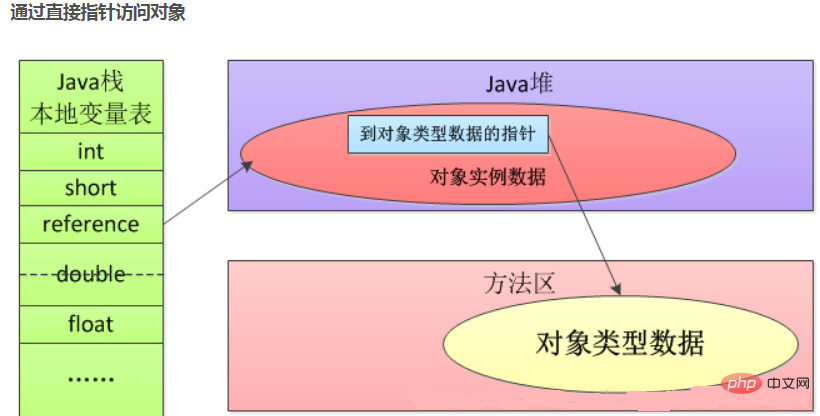
After talking about how objects are allocated, laid out and accessed in the java heap, let’s talk about memory allocation Principles
Principles of memory allocation:
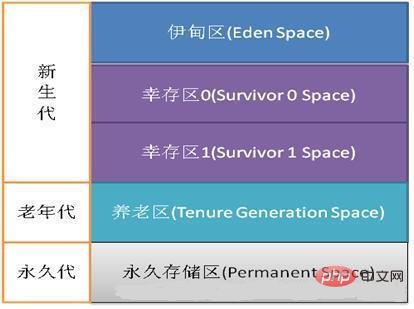
##The heap is roughly divided into the new generation, the old generation, and the permanent generation. The memory allocation of objects is mainly allocated in the Eden area of the new generation, and in a few cases, it is allocated directly to the old generation. The allocation rules are not 100% fixed and depend on the garbage collector combination and parameter settings. There are several allocation principles for reference below. (1) Objects are allocated in Eden first. (2) Large objects enter the old age directly. (3) Long-term surviving objects will enter the old generation. (4) Dynamic object age determination. (5) Space allocation guarantee. The above is the division of memory in the JAVA virtual machine. For more questions, please visit the PHP Chinese website:
The above is the detailed content of Detailed explanation of JAVA virtual machine (JVM) (2) - memory division. For more information, please follow other related articles on the PHP Chinese website!

Hot AI Tools

Undresser.AI Undress
AI-powered app for creating realistic nude photos

AI Clothes Remover
Online AI tool for removing clothes from photos.

Undress AI Tool
Undress images for free

Clothoff.io
AI clothes remover

Video Face Swap
Swap faces in any video effortlessly with our completely free AI face swap tool!

Hot Article

Hot Tools

Notepad++7.3.1
Easy-to-use and free code editor

SublimeText3 Chinese version
Chinese version, very easy to use

Zend Studio 13.0.1
Powerful PHP integrated development environment

Dreamweaver CS6
Visual web development tools

SublimeText3 Mac version
God-level code editing software (SublimeText3)

Hot Topics
 1654
1654
 14
14
 1413
1413
 52
52
 1306
1306
 25
25
 1252
1252
 29
29
 1225
1225
 24
24
 A distributed JVM monitoring tool, very practical!
Aug 15, 2023 pm 05:15 PM
This project is designed to facilitate developers to monitor multiple remote host JVMs faster. If your project is Spring boot, it is very easy to integrate. Just introduce the jar package. If it is not Spring boot, don’t be discouraged. You can quickly initialize a Spring boot program and introduce it yourself. Jar package is enough
 JVM memory management key points and precautions
Feb 20, 2024 am 10:26 AM
Key points and precautions for mastering JVM memory usage JVM (JavaVirtualMachine) is the environment in which Java applications run, and the most important one is the memory management of the JVM. Properly managing JVM memory can not only improve application performance, but also avoid problems such as memory leaks and memory overflows. This article will introduce the key points and considerations of JVM memory usage and provide some specific code examples. JVM memory partitions JVM memory is mainly divided into the following areas: Heap (He
 Detailed explanation of JVM command line parameters: the secret weapon to control JVM operation
May 09, 2024 pm 01:33 PM
JVM command line parameters allow you to adjust JVM behavior at a fine-grained level. The common parameters include: Set the Java heap size (-Xms, -Xmx) Set the new generation size (-Xmn) Enable the parallel garbage collector (-XX:+UseParallelGC) Reduce the memory usage of the Survivor area (-XX:-ReduceSurvivorSetInMemory) Eliminate redundancy Eliminate garbage collection (-XX:-EliminateRedundantGCs) Print garbage collection information (-XX:+PrintGC) Use the G1 garbage collector (-XX:-UseG1GC) Set the maximum garbage collection pause time (-XX:MaxGCPau
 Java Error: JVM memory overflow error, how to deal with and avoid
Jun 24, 2023 pm 02:19 PM
Java is a popular programming language. During the development of Java applications, you may encounter JVM memory overflow errors. This error usually causes the application to crash, affecting the user experience. This article will explore the causes of JVM memory overflow errors and how to deal with and avoid such errors. What is JVM memory overflow error? The Java Virtual Machine (JVM) is the running environment for Java applications. In the JVM, memory is divided into multiple areas, including heap, method area, stack, etc. The heap is used to store created objects
 Analysis of the functions and principles of JVM virtual machine
Feb 22, 2024 pm 01:54 PM
An introduction to the analysis of the functions and principles of the JVM virtual machine: The JVM (JavaVirtualMachine) virtual machine is one of the core components of the Java programming language, and it is one of the biggest selling points of Java. The role of the JVM is to compile Java source code into bytecodes and be responsible for executing these bytecodes. This article will introduce the role of JVM and how it works, and provide some code examples to help readers understand better. Function: The main function of JVM is to solve the problem of portability of Java programs on different platforms.
 Demystifying the working principle of JVM: In-depth exploration of the principles of Java virtual machine
Feb 18, 2024 pm 12:28 PM
Detailed explanation of JVM principles: In-depth exploration of the working principle of the Java virtual machine requires specific code examples 1. Introduction With the rapid development and widespread application of the Java programming language, the Java Virtual Machine (JavaVirtualMachine, referred to as JVM) has also become indispensable in software development. a part of. As the running environment for Java programs, JVM can provide cross-platform features, allowing Java programs to run on different operating systems. In this article, we will delve into how the JVM works
 How to adjust JVM heap memory size efficiently?
Feb 18, 2024 pm 01:39 PM
JVM memory parameter settings: How to reasonably adjust the heap memory size? In Java applications, the JVM is the key component responsible for managing memory. Among them, heap memory is used to store object instances. The size setting of heap memory has an important impact on the performance and stability of the application. This article will introduce how to reasonably adjust the heap memory size, with specific code examples. First, we need to understand some basic knowledge about JVM memory. The JVM's memory is divided into several areas, including heap memory, stack memory, method area, etc. in
 Java program to check if JVM is 32-bit or 64-bit
Sep 05, 2023 pm 06:37 PM
Before writing a java program to check whether the JVM is 32-bit or 64-bit, let us first discuss about the JVM. JVM is a java virtual machine, responsible for executing bytecode. It is part of the Java Runtime Environment (JRE). We all know that java is platform independent, but JVM is platform dependent. We need separate JVM for each operating system. If we have the bytecode of any java source code, we can easily run it on any platform due to JVM. The entire process of java file execution is as follows - First, we save the java source code with .java extension and the compiler converts it into bytecode with .class extension. This happens at compile time. Now, at runtime, J


