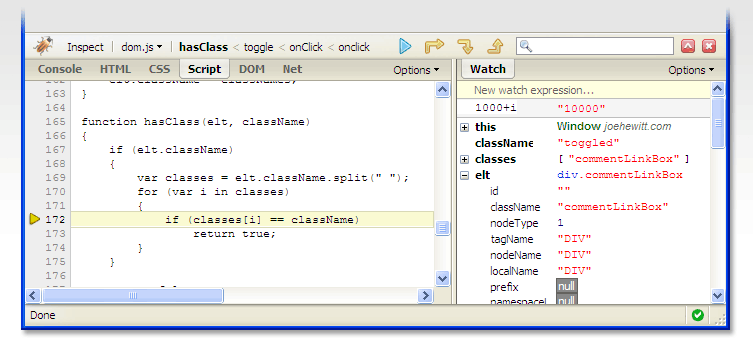
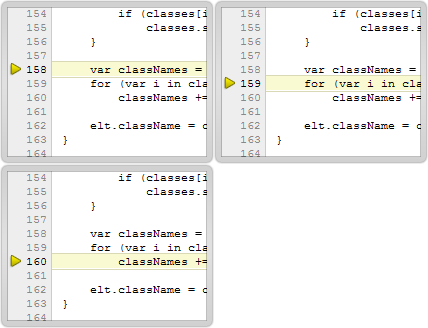
Needless to say, the installation is very simple. Just find FireBug in the plug-in library on FireFox and it will be OK. The picture below is the FireBug Debug window.

FireBug is very commonly used by artists, and the company’s artist sister is very skilled in using it. Haha, as for us developers, we mainly use it to debug JS. Take a look at the official introduction to the Debug function.
Firebug includes a powerful JavaScript debugger that lets you pause execution at any time and see what each variable looked like at that moment. If your code is a little sluggish, use the JavaScript profiler to measure performance and find bottlenecks fast.
In short, FireBug allows us to debug JS and view variables at any time, and at the same time, we can use it to find performance bottlenecks in JS.
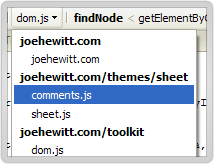
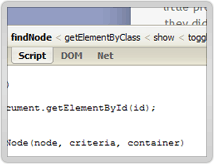
The picture below is how to find the JS of the web application, activate Firebug, click Script, and then select the JS you want to debug next to All.

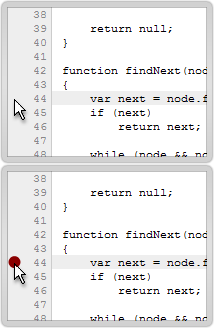
The picture below shows how to break points. It is basically the same as Eclipse. Click on the line number and it will be OK.

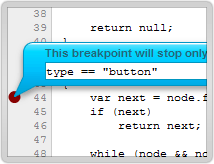
The picture below shows how to set conditions on breakpoints. If the conditions are met, the breakpoint will be entered. This function is very good, especially when debugging complex functions.

The picture below shows how to single-step debugging, just like Eclipse. F11 single-step

The picture below is to view the called Stack, which is very helpful for debugging complex JS.

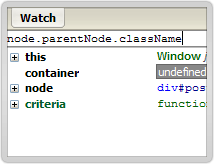
The picture below shows the variables, which are basically the same as EclipseDebug.

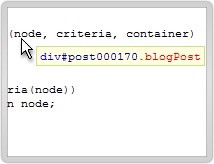
The picture below is to view the variables at the breakpoint.

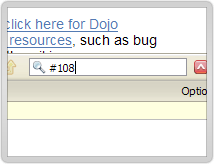
has a very useful function. It can quickly switch between lines of code, making it easy to debug thousands of lines of JS.

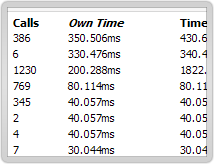
The picture below is the Performance test result. It is very simple to use. Click Profile

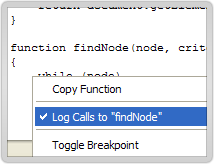
There is also a Log function that is more practical, see the picture below. If you don’t want to enter the breakpoint every time, it is best to use this.

That’s all the basic usage, I hope it will be helpful to everyone.

