PowerfulJavaScriptResponsive chart Chartist.js
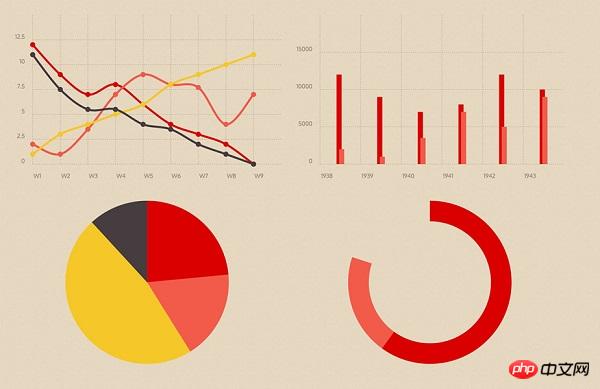
Chartist.js is a very simple and practical JavaScript front-end chartGenerator, it supports SVG format, chart data conversion is very flexible, and it also supports a variety of chart presentation forms, making it a development tool for front-end developers.
The configuration is very simple and can easily convert various chart data formats.
CSS and JavaScript are separated, so the code is relatively concise and relatively convenient to use.
Uses SVG format, so Chartist.js can be flexibly applied on Web pages.
Responsive chart, supports different browser sizes and resolutions.
Supports custom SASS architecture.

How to use Chartist.js
First you need to download the JS package and CSS package from its official website, and Quote them on the page:
<link rel="stylesheet" href="bower_components/chartist/dist/chartist.min.css">
<script src="bower_components/chartist/dist/chartist.min.js">
Below we will give a brief introduction to some commonly used chart types.
Rendering:

new Chartist.Line('.ct-chart', {
labels: ['1', '2', '3', '4', '5', '6'],
series: [
{
name: 'Fibonacci sequence',
data: [1, 2, 3, 5, 8, 13]
},
{
name: 'Golden section',
data: [1, 1.618, 2.618, 4.236, 6.854, 11.09]
}
]
});
var easeOutQuad = function (x, t, b, c, d) {
return -c * (t /= d) * (t - 2) + b;
};
var $chart = $('.ct-chart');
var $toolTip = $chart
.append('<p class="tooltip"></p>')
.find('.tooltip')
.hide();
$chart.on('mouseenter', '.ct-point', function() {
var $point = $(this),
value = $point.attr('ct:value'),
seriesName = $point.parent().attr('ct:series-name');
$point.animate({'stroke-width': '50px'}, 300, easeOutQuad);
$toolTip.html(seriesName + '<br>' + value).show();
});
$chart.on('mouseleave', '.ct-point', function() {
var $point = $(this);
$point.animate({'stroke-width': '20px'}, 300, easeOutQuad);
$toolTip.hide();
});
$chart.on('mousemove', function(event) {
$toolTip.css({
left: (event.offsetX || event.originalEvent.layerX) - $toolTip.width() / 2 - 10,
top: (event.offsetY || event.originalEvent.layerY) - $toolTip.height() - 40
});
});
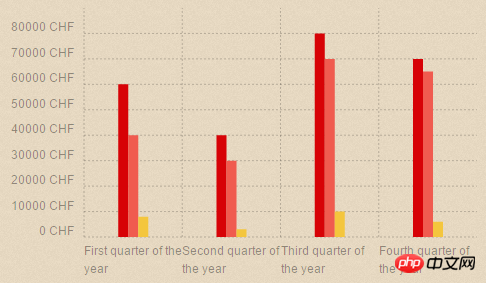
new Chartist.Bar('.ct-chart', {
  labels: ['First quarter of the year', 'Second quarter of the year', 'Third quarter of the year', 'Fourth quarter of the year'],
  series: [
    [60000, 40000, 80000, 70000],
    [40000, 30000, 70000, 65000],
    [8000, 3000, 10000, 6000]
  ]
}, {
  seriesBarDistance: 10,
  axisX: {
    offset: 60
  },
  axisY: {
    offset: 80,
    labelInterpolationFnc: function(value) {
      return value + ' CHF'
    },
    scaleMinSpace: 15
  }
}); ##JavaScript code:
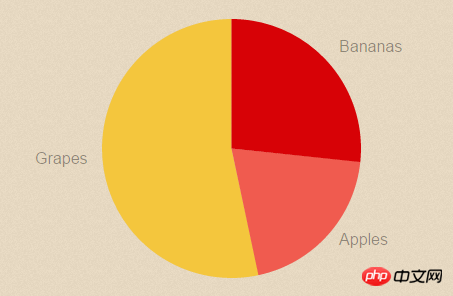
var data = {
  labels: ['Bananas', 'Apples', 'Grapes'],
  series: [20, 15, 40]
};

var options = {
  labelInterpolationFnc: function(value) {
    return value[0]
  }
};

var responsiveOptions = [
  ['screen and (min-width: 640px)', {
    chartPadding: 30,
    labelOffset: 100,
    labelDirection: 'explode',
    labelInterpolationFnc: function(value) {
      return value;
    }
  }],
  ['screen and (min-width: 1024px)', {
    labelOffset: 80,
    chartPadding: 20
  }]
];

new Chartist.Pie('.ct-chart', data, options, responsiveOptions);For more information about the usage of Chartist.js, you can go to its official website to check, including detailed
APIThe above is the detailed content of Detailed introduction to the powerful JavaScript responsive chart Chartist.js (image and text). For more information, please follow other related articles on the PHP Chinese website!


