Share 5 essential debugging skills for JavaScript debugging
In our daily development work, we all have to debug and modify bugs. Many friends will use printf to debug the program. Generally speaking, it goes smoothly, but sometimes, you will find that you need to do more Good method. So today we will take you to learn about the 5 debugging skills necessary for JavaScript debugging!
1. debugger;
I have said before that you can add a sentence debugger; to the JavaScript code to manually create a breakpoint Effect.
Do you need conditional breakpoints? You just need to surround it with if statements:
The code is as follows:
if (somethingHappens) {
  debugger;
}But remember to delete them before publishing the program.
2. Set a breakpoint to trigger when the DOM node changes
Sometimes you will find that the DOM is not under your control and some strange changes will occur. Makes it difficult for you to find the source of the problem.
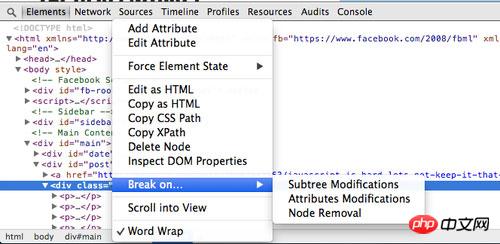
There is a super easy-to-use function in the development tools of Google Chrome, which can specifically deal with this situation, called "Break on..." , you are in the DOM nodeRight-click to see this menu item.
The triggering condition of the breakpoint can be set when the node is deleted, there is any change in the node's attributes, or there is a change in one of its child nodes.
3. Ajax Breakpoints
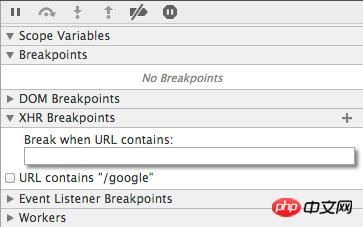
XHR breakpoints, or Ajax breakpoints, as their names suggest, allow We set a breakpoint that triggers the specific Ajax calls when they occur.
This trick is very effective when you are debugging network transmission of web applications.
4. Mobile device simulation environment
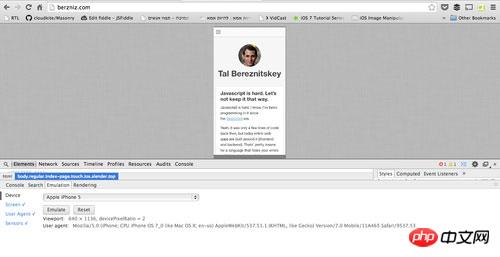
There are some very interesting tools in Google Chrome to simulate mobile devices to help us Debug the running of the program on mobile devices.
The way to find it is: press F12 to bring up the developer tools, and then press the ESC key (the current tab cannot be Console), and you will see the second layer of debugging windows appear. , there are various simulation devices available in the Emulationtab.
Of course, this will not become a real iPhone, it just simulates the size of the iPhone, touch events and browser User Agent values.
#5. Improve your website with Audits
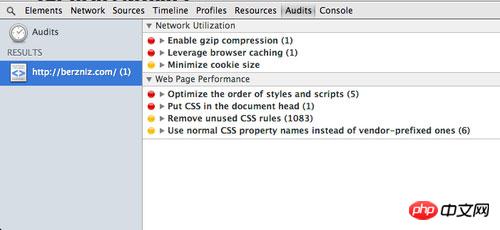
YSlow is a great tool. There is a very similar tool in the developer tools of Google Chrome called Audits.
It can quickly audit your website and give you very practical and effective suggestions and methods for optimizing your website.
Summary:
This article introduces JavaScript in the form of pictures and texts. 5 debugDebugging skills, I believe many friends can have many choices, I hope it will be helpful to your work!
Related recommendations:
Introduction to the use of debug function debug_backtrace in PHP
The above is the detailed content of Share 5 essential debugging skills for JavaScript debugging. For more information, please follow other related articles on the PHP Chinese website!

Hot AI Tools

Undresser.AI Undress
AI-powered app for creating realistic nude photos

AI Clothes Remover
Online AI tool for removing clothes from photos.

Undress AI Tool
Undress images for free

Clothoff.io
AI clothes remover

Video Face Swap
Swap faces in any video effortlessly with our completely free AI face swap tool!

Hot Article

Hot Tools

Notepad++7.3.1
Easy-to-use and free code editor

SublimeText3 Chinese version
Chinese version, very easy to use

Zend Studio 13.0.1
Powerful PHP integrated development environment

Dreamweaver CS6
Visual web development tools

SublimeText3 Mac version
God-level code editing software (SublimeText3)

Hot Topics
 1657
1657
 14
14
 1415
1415
 52
52
 1309
1309
 25
25
 1257
1257
 29
29
 1229
1229
 24
24
 How to implement an online speech recognition system using WebSocket and JavaScript
Dec 17, 2023 pm 02:54 PM
How to use WebSocket and JavaScript to implement an online speech recognition system Introduction: With the continuous development of technology, speech recognition technology has become an important part of the field of artificial intelligence. The online speech recognition system based on WebSocket and JavaScript has the characteristics of low latency, real-time and cross-platform, and has become a widely used solution. This article will introduce how to use WebSocket and JavaScript to implement an online speech recognition system.
 Recommended: Excellent JS open source face detection and recognition project
Apr 03, 2024 am 11:55 AM
Face detection and recognition technology is already a relatively mature and widely used technology. Currently, the most widely used Internet application language is JS. Implementing face detection and recognition on the Web front-end has advantages and disadvantages compared to back-end face recognition. Advantages include reducing network interaction and real-time recognition, which greatly shortens user waiting time and improves user experience; disadvantages include: being limited by model size, the accuracy is also limited. How to use js to implement face detection on the web? In order to implement face recognition on the Web, you need to be familiar with related programming languages and technologies, such as JavaScript, HTML, CSS, WebRTC, etc. At the same time, you also need to master relevant computer vision and artificial intelligence technologies. It is worth noting that due to the design of the Web side
 WebSocket and JavaScript: key technologies for implementing real-time monitoring systems
Dec 17, 2023 pm 05:30 PM
WebSocket and JavaScript: Key technologies for realizing real-time monitoring systems Introduction: With the rapid development of Internet technology, real-time monitoring systems have been widely used in various fields. One of the key technologies to achieve real-time monitoring is the combination of WebSocket and JavaScript. This article will introduce the application of WebSocket and JavaScript in real-time monitoring systems, give code examples, and explain their implementation principles in detail. 1. WebSocket technology
 Essential tools for stock analysis: Learn the steps to draw candle charts with PHP and JS
Dec 17, 2023 pm 06:55 PM
Essential tools for stock analysis: Learn the steps to draw candle charts in PHP and JS. Specific code examples are required. With the rapid development of the Internet and technology, stock trading has become one of the important ways for many investors. Stock analysis is an important part of investor decision-making, and candle charts are widely used in technical analysis. Learning how to draw candle charts using PHP and JS will provide investors with more intuitive information to help them make better decisions. A candlestick chart is a technical chart that displays stock prices in the form of candlesticks. It shows the stock price
 How to use JavaScript and WebSocket to implement a real-time online ordering system
Dec 17, 2023 pm 12:09 PM
Introduction to how to use JavaScript and WebSocket to implement a real-time online ordering system: With the popularity of the Internet and the advancement of technology, more and more restaurants have begun to provide online ordering services. In order to implement a real-time online ordering system, we can use JavaScript and WebSocket technology. WebSocket is a full-duplex communication protocol based on the TCP protocol, which can realize real-time two-way communication between the client and the server. In the real-time online ordering system, when the user selects dishes and places an order
 PHP and JS Development Tips: Master the Method of Drawing Stock Candle Charts
Dec 18, 2023 pm 03:39 PM
With the rapid development of Internet finance, stock investment has become the choice of more and more people. In stock trading, candle charts are a commonly used technical analysis method. It can show the changing trend of stock prices and help investors make more accurate decisions. This article will introduce the development skills of PHP and JS, lead readers to understand how to draw stock candle charts, and provide specific code examples. 1. Understanding Stock Candle Charts Before introducing how to draw stock candle charts, we first need to understand what a candle chart is. Candlestick charts were developed by the Japanese
 JavaScript and WebSocket: Building an efficient real-time weather forecasting system
Dec 17, 2023 pm 05:13 PM
JavaScript and WebSocket: Building an efficient real-time weather forecast system Introduction: Today, the accuracy of weather forecasts is of great significance to daily life and decision-making. As technology develops, we can provide more accurate and reliable weather forecasts by obtaining weather data in real time. In this article, we will learn how to use JavaScript and WebSocket technology to build an efficient real-time weather forecast system. This article will demonstrate the implementation process through specific code examples. We
 Simple JavaScript Tutorial: How to Get HTTP Status Code
Jan 05, 2024 pm 06:08 PM
JavaScript tutorial: How to get HTTP status code, specific code examples are required. Preface: In web development, data interaction with the server is often involved. When communicating with the server, we often need to obtain the returned HTTP status code to determine whether the operation is successful, and perform corresponding processing based on different status codes. This article will teach you how to use JavaScript to obtain HTTP status codes and provide some practical code examples. Using XMLHttpRequest


