 Web Front-end
 JS Tutorial
 Illustrated tutorial on how to debug dynamic js scripts in the browser
Illustrated tutorial on how to debug dynamic js scripts in the browser
This article mainly introduces the method of debugging dynamic js scripts in the browser. The article brings you two debugging methods, which are very good and have reference value. Friends in need can refer to them. I hope it can help everyone.
Two days ago, I pulled the company's front-end code modifications and found that in the sources option of the developer tools, the js script I wanted to debug was not listed. Later, I observed that the script was dynamic on the page. Introduced in, it may not be displayed because of this, but if you can't debug with breakpoints, just printing logs will be really tiring, and the efficiency is too low. I tried it by searching the Internet, and there are two ways to solve it:
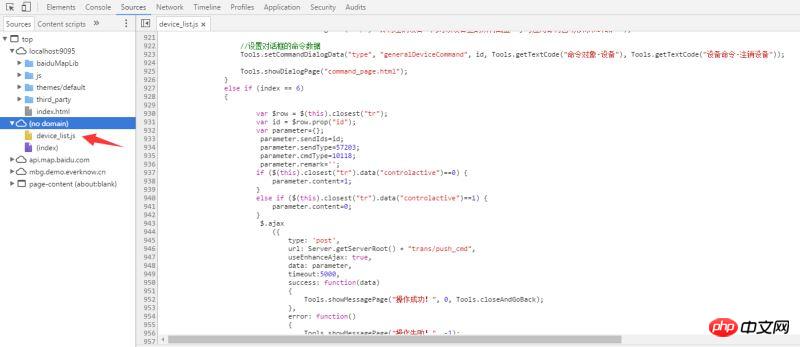
1. Add //# sourceURL=xxxxxxxxx.js in the script. Name it yourself. You can use the file name directly, as shown below:

Then add Open the page containing this js in the web page, so that it can be seen in the developer tools, and you can break points and debug normally like ordinary js
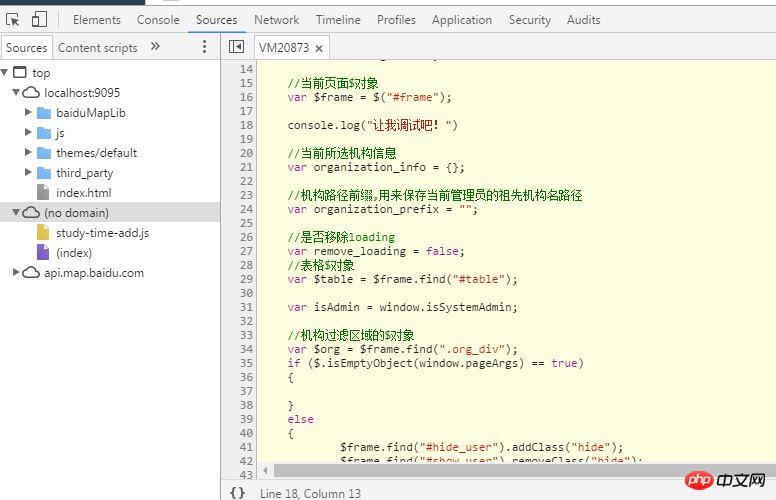
2. The second method is to use console.log("Let me debug it!") to print the log. After seeing the output in the browser console, click on the following link to jump into the dynamic script. The name is generally vmXXX, as shown below:

Web Inspector: Introduction to debugging JS in Sublime Text_Basic knowledge
FireBug Debugging JS introductory tutorial How to debug JS_javascript skills
Must-see js breakpoints Debugging experience sharing
The above is the detailed content of Illustrated tutorial on how to debug dynamic js scripts in the browser. For more information, please follow other related articles on the PHP Chinese website!

Hot AI Tools

Undresser.AI Undress
AI-powered app for creating realistic nude photos

AI Clothes Remover
Online AI tool for removing clothes from photos.

Undress AI Tool
Undress images for free

Clothoff.io
AI clothes remover

Video Face Swap
Swap faces in any video effortlessly with our completely free AI face swap tool!

Hot Article

Hot Tools

Notepad++7.3.1
Easy-to-use and free code editor

SublimeText3 Chinese version
Chinese version, very easy to use

Zend Studio 13.0.1
Powerful PHP integrated development environment

Dreamweaver CS6
Visual web development tools

SublimeText3 Mac version
God-level code editing software (SublimeText3)

Hot Topics
 1657
1657
 14
14
 1415
1415
 52
52
 1309
1309
 25
25
 1257
1257
 29
29
 1229
1229
 24
24
 How to implement an online speech recognition system using WebSocket and JavaScript
Dec 17, 2023 pm 02:54 PM
How to use WebSocket and JavaScript to implement an online speech recognition system Introduction: With the continuous development of technology, speech recognition technology has become an important part of the field of artificial intelligence. The online speech recognition system based on WebSocket and JavaScript has the characteristics of low latency, real-time and cross-platform, and has become a widely used solution. This article will introduce how to use WebSocket and JavaScript to implement an online speech recognition system.
 How to remove Firefox Snap in Ubuntu Linux?
Feb 21, 2024 pm 07:00 PM
To remove FirefoxSnap in Ubuntu Linux, you can follow these steps: Open a terminal and log in to your Ubuntu system as administrator. Run the following command to uninstall FirefoxSnap: sudosnapremovefirefox You will be prompted for your administrator password. Enter your password and press Enter to confirm. Wait for command execution to complete. Once completed, FirefoxSnap will be completely removed. Note that this will remove versions of Firefox installed via the Snap package manager. If you installed another version of Firefox through other means (such as the APT package manager), you will not be affected. Go through the above steps
 WebSocket and JavaScript: key technologies for implementing real-time monitoring systems
Dec 17, 2023 pm 05:30 PM
WebSocket and JavaScript: Key technologies for realizing real-time monitoring systems Introduction: With the rapid development of Internet technology, real-time monitoring systems have been widely used in various fields. One of the key technologies to achieve real-time monitoring is the combination of WebSocket and JavaScript. This article will introduce the application of WebSocket and JavaScript in real-time monitoring systems, give code examples, and explain their implementation principles in detail. 1. WebSocket technology
 How to use JavaScript and WebSocket to implement a real-time online ordering system
Dec 17, 2023 pm 12:09 PM
Introduction to how to use JavaScript and WebSocket to implement a real-time online ordering system: With the popularity of the Internet and the advancement of technology, more and more restaurants have begun to provide online ordering services. In order to implement a real-time online ordering system, we can use JavaScript and WebSocket technology. WebSocket is a full-duplex communication protocol based on the TCP protocol, which can realize real-time two-way communication between the client and the server. In the real-time online ordering system, when the user selects dishes and places an order
 How to implement an online reservation system using WebSocket and JavaScript
Dec 17, 2023 am 09:39 AM
How to use WebSocket and JavaScript to implement an online reservation system. In today's digital era, more and more businesses and services need to provide online reservation functions. It is crucial to implement an efficient and real-time online reservation system. This article will introduce how to use WebSocket and JavaScript to implement an online reservation system, and provide specific code examples. 1. What is WebSocket? WebSocket is a full-duplex method on a single TCP connection.
 JavaScript and WebSocket: Building an efficient real-time weather forecasting system
Dec 17, 2023 pm 05:13 PM
JavaScript and WebSocket: Building an efficient real-time weather forecast system Introduction: Today, the accuracy of weather forecasts is of great significance to daily life and decision-making. As technology develops, we can provide more accurate and reliable weather forecasts by obtaining weather data in real time. In this article, we will learn how to use JavaScript and WebSocket technology to build an efficient real-time weather forecast system. This article will demonstrate the implementation process through specific code examples. We
 Simple JavaScript Tutorial: How to Get HTTP Status Code
Jan 05, 2024 pm 06:08 PM
JavaScript tutorial: How to get HTTP status code, specific code examples are required. Preface: In web development, data interaction with the server is often involved. When communicating with the server, we often need to obtain the returned HTTP status code to determine whether the operation is successful, and perform corresponding processing based on different status codes. This article will teach you how to use JavaScript to obtain HTTP status codes and provide some practical code examples. Using XMLHttpRequest
 How to use insertBefore in javascript
Nov 24, 2023 am 11:56 AM
Usage: In JavaScript, the insertBefore() method is used to insert a new node in the DOM tree. This method requires two parameters: the new node to be inserted and the reference node (that is, the node where the new node will be inserted).


