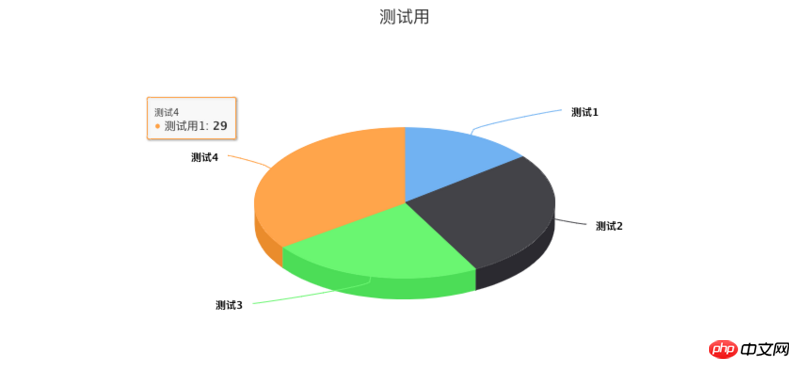
This article mainly introduces the method of using highCharts to draw 3D pie charts in Vue. Now I will share it with you and give you a reference.
highcharts is a well-known foreign chart library based on javascript. Since the configuration of using highcharts in Vue on the Chinese official website is cumbersome and requires the introduction of jquery as a dependency, it is deprecated.
Next, let me give you a brief introduction to the use and configuration of highcharts in vue.
First use npm to install vue-highcharts in your project
npm install vue-highcharts --save
Since vue-highcharts depends on highcharts, we also need to install the latter
npm install highcharts --save
After the installation is completed, Enter the project main.js for configuration:
import highcharts from 'highcharts'
import VueHighCharts from 'vue-highcharts'
After introducing the above two items, because we need to use 3d charts, we also need to introduce:
import highcharts3d from 'highcharts/highcharts-3d'
Call the 3d charts:
highcharts3d(highcharts)
OK, so far highcharts has been configured in vue. Next, draw a 3d pie chart according to the API.
Create a pie chart component:
<template>
<p class="container">
<p :id="id" :option="option"></p>
</p>
</template>
<script>
import HighCharts from 'highcharts'
export default {
props: {
id: {
type: String
},
//option 是图表的配置数据
option: {
type: Object
}
},
mounted() {
HighCharts.chart(this.id, this.option)
}
}
</script>
<style scoped>
/* 容器 */
.container {
width: 1000px;
height: 550px;
}
</style>On the page where you need to use the pie chart Configure the option data
<template>
<p class="charts">
<pie :id="id" :option="option"></pie>
</p>
</p>
</template>
<script>
import pie from '../components/pie'
import manes from '../components/list'
export default {
components: {
pie,
},
data() {
return {
id: 'test',
option: {
chart: {
type: 'pie',//饼图
options3d: {
enabled: true,//使用3d功能
alpha: 60,//延y轴向内的倾斜角度
beta: 0,
}
},
title: {
text: '测试用'//图表的标题文字
},
subtitle: {
text: ''//副标题文字
},
plotOptions: {
pie: {
allowPointSelect: true,//每个扇块能否选中
cursor: 'pointer',//鼠标指针
depth: 35,//饼图的厚度
dataLabels: {
enabled: true,//是否显示饼图的线形tip
}
}
},
series: [
{
type: 'pie',
name: '测试用1',//统一的前置词,非必须
data: [
['测试1',12],//模块名和所占比,也可以{name: '测试1',y: 12}
['测试2',23],
['测试3',19],
['测试4',29]
]
}
]
}
}
},
}
</script>
<style scoped>
</style>to see the effect.

The above is what I compiled for everyone. I hope it will be helpful to everyone in the future.
Related articles:
How to solve the problem when Vue.js displays data, the page flashes
ajax request vue.js rendering page loading
How to use ajax to render the page in vue.js
The above is the detailed content of How to use highCharts to draw a 3d pie chart in Vue. For more information, please follow other related articles on the PHP Chinese website!


