 Web Front-end
 JS Tutorial
 Summary and sharing: 6 ways to break points in JavaScript (collect for learning)
Summary and sharing: 6 ways to break points in JavaScript (collect for learning)
This article will summarize and share with you 6 ways to break points in JavaScript. It is worth learning and collecting. Come and see how many of them you have used? I hope to be helpful!

#Debugger is a very important tool for front-end development. It can stop at the code we care about and clarify the logic through single-step operation. The quality of debugger is directly related to the quality of breakpoints.
Chrome Devtools and VSCode both provide Debugger, which supports 6 breakpoint methods.
Normal breakpoint
You can add a breakpoint by clicking on the left side of the line you want to break, and it will break when running there.
This is the most basic breakpoint method. Both VSCode and Chrome Devtools support this breakpoint. [Related recommendations: javascript learning tutorial]
Conditional breakpoint
Right-click on the left side of the line where the code is located, and a drop-down box will appear , you can add a conditional breakpoint.

#Enter a conditional expression. When this line of code is reached and the value of the expression is true, it will break. This is more flexible than ordinary breakpoints.

This kind of breakpoint based on conditions is also supported by VSCode and Chrome Devtools.

DOM breakpoint
Right-click on the corresponding element in the Elements panel of Chrome Devtools and select break on to add a dom breakpoint, that is, when It will be interrupted when the subtree changes, the attributes change, or the node is removed. Can be used to debug code that causes dom changes.


Because it involves DOM debugging, only Chrome Devtools supports this breakpoint.
URL breakpoint
You can add XHR url breakpoint in the Sources panel of Chrome Devtools. When the ajax request corresponds to the url, it will break and can be used to debug the request-related code.

This feature is only available in Chrome Devtools.
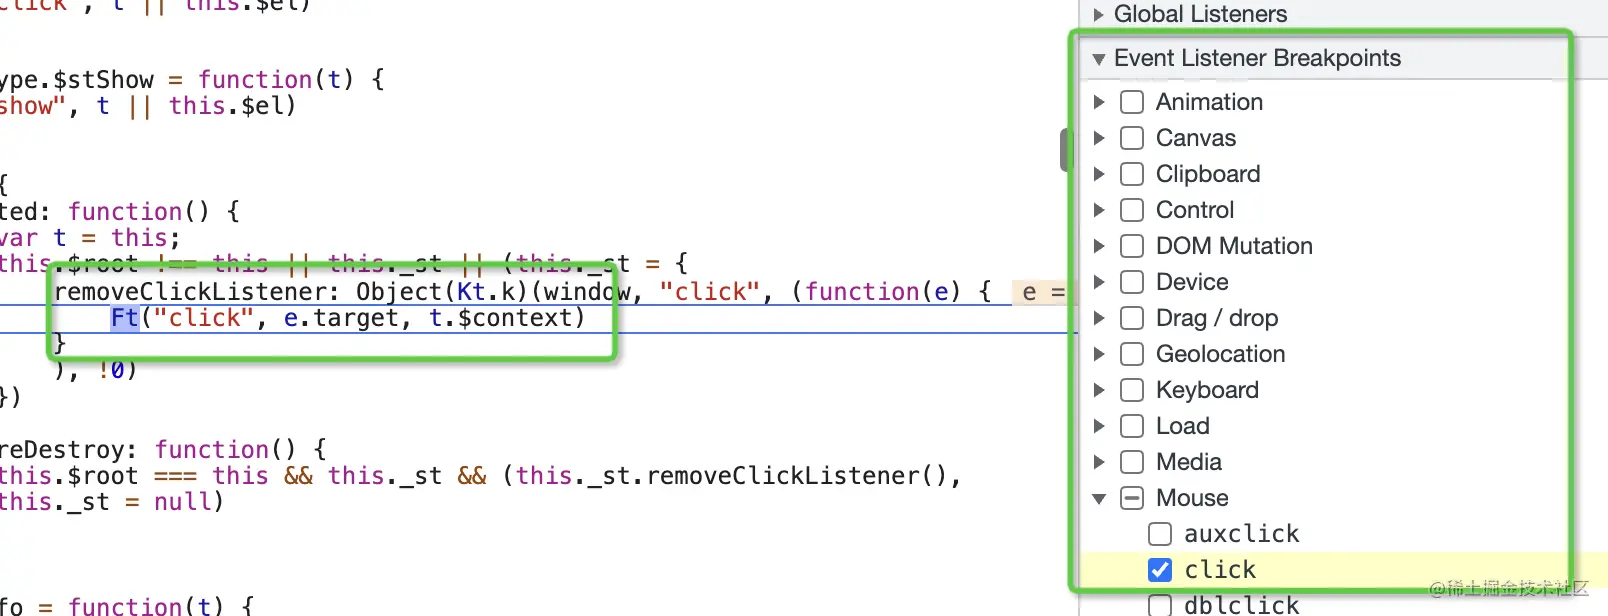
Event Listener breakpoint
In the Sources panel of Chrome Devtools, you can also add an Event Listener breakpoint to specify what event to break when it occurs, which can be used to debug event-related code.

This feature is only available in Chrome Devtools.
Exception breakpoints
Check Uncaught Exceptions and Caught Exceptions in the Debugger panel of VSCode to add exception breakpoints and break the column when an exception is thrown and is not caught or caught. It is useful when debugging some code where exceptions occur.
Summary
In addition to the ordinary breakpoints that are directly clicked on the corresponding line of code, Debugger has many breakpoints based on different situations. How to add breakpoints.
There are six types in total:
- Ordinary breakpoint: Break when the operation reaches that point
- Conditional breakpoint: Break when running there and the expression is true, more flexible than ordinary breakpoints
- DOM breakpoint : When the DOM subtree changes, attributes change, or node is deleted Break, can be used to debug the code that causes DOM changes
- URL breakpoint: Break when the URL matches a certain pattern, can be used to debug request-related code
- Event Listener breakpoint: Break when an event listener is triggered, which can be used to debug event-related code
- Exception breakpoint: When an exception is thrown Breaking when caught or not caught can be used to debug the code where the exception occurs
Most of these breakpoint methods are supported by Chrome Devtools (normal, conditional, DOM, URL, Event Listener, exception), and some are supported by VSCode Debugger (normal, conditional, exception).
Code under different situations can use different break point methods, so debugging the code will be much more efficient. How many of these six breakpoint methods have you used?
(Learning video sharing: web front-end tutorial)
The above is the detailed content of Summary and sharing: 6 ways to break points in JavaScript (collect for learning). For more information, please follow other related articles on the PHP Chinese website!

Hot AI Tools

Undresser.AI Undress
AI-powered app for creating realistic nude photos

AI Clothes Remover
Online AI tool for removing clothes from photos.

Undress AI Tool
Undress images for free

Clothoff.io
AI clothes remover

AI Hentai Generator
Generate AI Hentai for free.

Hot Article

Hot Tools

Notepad++7.3.1
Easy-to-use and free code editor

SublimeText3 Chinese version
Chinese version, very easy to use

Zend Studio 13.0.1
Powerful PHP integrated development environment

Dreamweaver CS6
Visual web development tools

SublimeText3 Mac version
God-level code editing software (SublimeText3)

Hot Topics
 1377
1377
 52
52
 How to implement an online speech recognition system using WebSocket and JavaScript
Dec 17, 2023 pm 02:54 PM
How to use WebSocket and JavaScript to implement an online speech recognition system Introduction: With the continuous development of technology, speech recognition technology has become an important part of the field of artificial intelligence. The online speech recognition system based on WebSocket and JavaScript has the characteristics of low latency, real-time and cross-platform, and has become a widely used solution. This article will introduce how to use WebSocket and JavaScript to implement an online speech recognition system.
 WebSocket and JavaScript: key technologies for implementing real-time monitoring systems
Dec 17, 2023 pm 05:30 PM
WebSocket and JavaScript: Key technologies for realizing real-time monitoring systems Introduction: With the rapid development of Internet technology, real-time monitoring systems have been widely used in various fields. One of the key technologies to achieve real-time monitoring is the combination of WebSocket and JavaScript. This article will introduce the application of WebSocket and JavaScript in real-time monitoring systems, give code examples, and explain their implementation principles in detail. 1. WebSocket technology
 How to use JavaScript and WebSocket to implement a real-time online ordering system
Dec 17, 2023 pm 12:09 PM
Introduction to how to use JavaScript and WebSocket to implement a real-time online ordering system: With the popularity of the Internet and the advancement of technology, more and more restaurants have begun to provide online ordering services. In order to implement a real-time online ordering system, we can use JavaScript and WebSocket technology. WebSocket is a full-duplex communication protocol based on the TCP protocol, which can realize real-time two-way communication between the client and the server. In the real-time online ordering system, when the user selects dishes and places an order
 How to implement an online reservation system using WebSocket and JavaScript
Dec 17, 2023 am 09:39 AM
How to use WebSocket and JavaScript to implement an online reservation system. In today's digital era, more and more businesses and services need to provide online reservation functions. It is crucial to implement an efficient and real-time online reservation system. This article will introduce how to use WebSocket and JavaScript to implement an online reservation system, and provide specific code examples. 1. What is WebSocket? WebSocket is a full-duplex method on a single TCP connection.
 JavaScript and WebSocket: Building an efficient real-time weather forecasting system
Dec 17, 2023 pm 05:13 PM
JavaScript and WebSocket: Building an efficient real-time weather forecast system Introduction: Today, the accuracy of weather forecasts is of great significance to daily life and decision-making. As technology develops, we can provide more accurate and reliable weather forecasts by obtaining weather data in real time. In this article, we will learn how to use JavaScript and WebSocket technology to build an efficient real-time weather forecast system. This article will demonstrate the implementation process through specific code examples. We
 Simple JavaScript Tutorial: How to Get HTTP Status Code
Jan 05, 2024 pm 06:08 PM
JavaScript tutorial: How to get HTTP status code, specific code examples are required. Preface: In web development, data interaction with the server is often involved. When communicating with the server, we often need to obtain the returned HTTP status code to determine whether the operation is successful, and perform corresponding processing based on different status codes. This article will teach you how to use JavaScript to obtain HTTP status codes and provide some practical code examples. Using XMLHttpRequest
 How to use insertBefore in javascript
Nov 24, 2023 am 11:56 AM
Usage: In JavaScript, the insertBefore() method is used to insert a new node in the DOM tree. This method requires two parameters: the new node to be inserted and the reference node (that is, the node where the new node will be inserted).
 How to get HTTP status code in JavaScript the easy way
Jan 05, 2024 pm 01:37 PM
Introduction to the method of obtaining HTTP status code in JavaScript: In front-end development, we often need to deal with the interaction with the back-end interface, and HTTP status code is a very important part of it. Understanding and obtaining HTTP status codes helps us better handle the data returned by the interface. This article will introduce how to use JavaScript to obtain HTTP status codes and provide specific code examples. 1. What is HTTP status code? HTTP status code means that when the browser initiates a request to the server, the service


)
