

Python을 사용하여 실시간 GitHub 통계 대시보드 구축

GitHub Firehose API를 사용하여 가장 활동적인 GitHub 사용자를 실시간으로 시각화
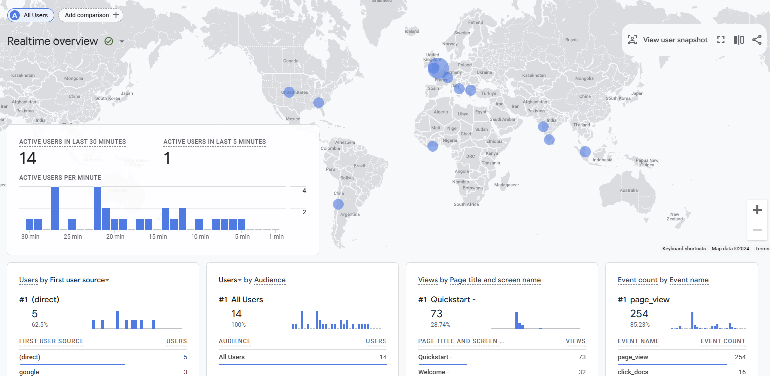
Google Analytics의 실시간 대시보드를 사용해 본 적이 있습니까? 사람들이 귀하의 웹사이트와 실시간으로 상호 작용하는 모습을 보는 것은 정말 흥미롭습니다. GitHub timelime을 사용하여 유사한 것을 구축할 수 있다는 것을 알고 계셨습니까?
Streamlit에서는 기본 프로토타입을 만드는 것이 놀라울 정도로 쉽습니다. 매우 간단하고 최소한의 MVP 버전의 실시간 대시보드를 구축하는 방법을 보여드리고 싶습니다. GitHub 이벤트의 공개 스트림, 즉 GitHub Firehose를 사용할 수 있습니다.
이를 사용하면 GitHub 사용자 이름별로 이벤트 수를 추적하고 현재 상위 10개를 표시하는 매우 간단한 파이프라인과 대시보드를 구축할 수 있습니다.
다음은 GithubFirehose API에서 얻는 페이로드의 미리보기입니다. 이 튜토리얼에서는 그 중 작은 부분("배우" 개체)만 사용할 것입니다
{
    "id": "41339742815",
    "type": "WatchEvent",
    "actor": {
        "id": 12345678,
        "login": "someuser123",
        "display_login": "someuser123",
        "gravatar_id": "",
        "url": "https://api.github.com/users/someuser123",
        "avatar_url": "https://avatars.githubusercontent.com/u/12345678?",
    },
    "repo": {
        "id": 89012345,
        "name": "someorg/somerepo",
        "url": "https://api.github.com/repos/someorg/somerepo",
    },
    "payload": {
        "action": "started"
    },
    "public": true,
    "created_at": "2024-08-26T12:21:53Z"
}
하지만 Firehose를 Streamlit에 연결할 수는 없으며 먼저 데이터를 처리하기 위한 백엔드가 필요합니다. 왜요?
Streamlit에서 실시간 데이터를 렌더링하는 것은 어려울 수 있습니다
Streamlit은 Python을 사용하여 대화형 애플리케이션 프로토타입을 빠르게 제작할 수 있는 환상적인 도구입니다. 그러나 실시간 데이터 렌더링과 관련하여 Streamlit은 약간 까다로울 수 있습니다. GitHub Firehose를 Kafka로 쉽게 스트리밍할 수 있습니다(제 동료 Kris Jenkins가 Python의 High Performance Kafka Producers라는 훌륭한 튜토리얼을 제공합니다)
하지만 Streamlit을 사용하여 Kafka에서 직접 사용하는 데이터를 렌더링하는 것은 다소 복잡할 수 있습니다. Streamlit은 매 밀리초마다 흐르는 연속적인 데이터 스트림을 처리하도록 설계되지 않았습니다. 어쨌든 해당 빈도로 새로 고치기 위해 시각화가 실제로 필요하지는 않습니다.
소스 데이터 스트림이 밀리초마다 업데이트되더라도(예: 매우 바쁜 서버 로그) 매초마다 데이터의 스냅샷을 표시할 수 있습니다. 이렇게 하려면 해당 데이터를 데이터베이스에 싱크하고 Streamlit이 보다 관리하기 쉬운 속도로 폴링할 수 있는 API 뒤에 배치해야 합니다.
API 뒤에 데이터를 배치하면 Streamlit이 더 쉽게 처리할 수 있을 뿐만 아니라 다른 도구에서도 데이터에 액세스할 수 있습니다. 이 접근 방식에는 약간의 백엔드 개발이 필요하지만 걱정하지 마세요. 로컬에서 시작하는 데 도움이 되는 Docker 컨테이너 세트와 Docker Compose 파일을 준비했습니다.
완전한 백엔드 초보자라도 이것이 어떻게 작동하는지 이해할 수 있다고 약속합니다.
건축
우리가 사용할 구성 요소에 대한 간략한 개요는 다음과 같습니다.
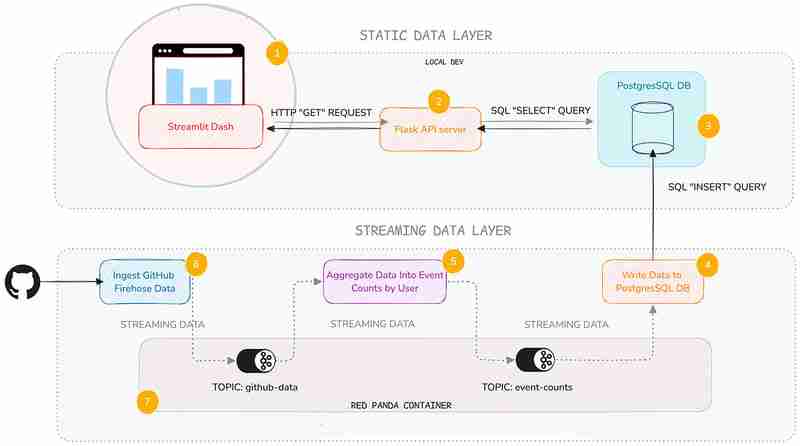
예, 복잡해 보이지만 정적 데이터 계층, 즉 API 서비스와 Streamlit 대시보드에 중점을 두겠습니다. 여기서는 스트리밍 데이터 레이어의 어두운 깊이를 다루지는 않겠습니다(그러나 더 알고 싶은 경우를 대비해 몇 가지 링크를 제공하겠습니다).
스트리밍 백엔드를 직접 유지 관리할 필요가 없더라도 일반적으로 스트리밍 백엔드가 어떻게 작동하는지 알면 편리하기 때문에 이 레이어를 추가했습니다.
각 서비스의 기능에 대한 간략한 설명은 다음과 같습니다.
| Service | Description |
|---|---|
| Streamlit Service | Displays a Streamlit Dashboard which polls the API and renders the data in a chart and table. |
| Flask API | Serves a minimal REST API that can query a database and return the results as JSON. |
| Postgres Database | Stores the event count data. |
| Postgres Writer Service | Reads from a topic and continuously updates the database with new data. |
| Aggregation Service | Refines the raw event logs and continuously aggregates them into event counts broken down by GitHub display name. |
| Streaming Data Producer | Reads from a real-time public feed of activity on GitHub and streams the data to a topic in Redpanda (our local message broker). |
| Red Panda Server | Manages the flow of streaming data via topics (buffers for streaming data). |
You can inspect the code in the accompanying Github repo. Each service has its own subfolder, with code and a README:
Setting Up Your Environment
To get started, you’ll need Docker with Docker Compose installed (and Git of course). The easiest way is to install Docker Desktop. Once you have Docker set up, follow these steps:
1. Clone the repository:
git clone https://github.com/quixio/template-streamlit-rt-githubdash
2. Navigate to the repository:
cd template-streamlit-rt-githubdash
3. Spin up the Containers:
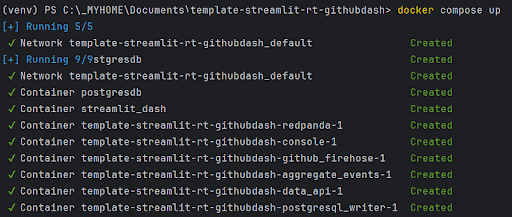
docker compose up
You should see some log entries that look like this (make sure Docker Desktop is running).
4. Visit the Streamlit URL
Open your browser and go to http://localhost:8031. You should see your dashboard running.
Code explanation
Let’s take a look at the two main components of the static data layer: the dashboard and the data API.
The Streamlit Dashboard
Now, let’s look at how the Streamlit app uses this API. It polls the API, gets the results back as JSON, turns the JSON into a dataframe, then caches the results. To refresh the results, the cache is cleared at a defined interval (currently 1 second) so that Streamlit needs to retrieve the data again.
import streamlit as st
import requests
import time
import pandas as pd
import os
import logging
from datetime import datetime
import plotly.express as px

from dotenv import load_dotenv
load_dotenv() ### for local dev, outside of docker, load env vars from a .env file

logging.basicConfig(level=logging.INFO)
logger = logging.getLogger(__name__)

# API endpoint URL
api_url = os.environ['API_URL']

## Function to get data from the API
def get_data():
   print(f"[{datetime.now()}] Fetching data from API...")
   response = requests.get(api_url)
   data = response.json()
   df = pd.DataFrame(data)

   try:
       # Reorder columns
       # df = df[['page_id', 'count']]
       df = df[['displayname', 'event_count']]
   except:
       logger.info("No data yet...")

   return df

# Function to get data and cache it
@st.cache_data
def get_cached_data():
   return get_data()

# Streamlit UI
st.title("Real-time Dashboard for GitHub Data using Streamlit,Flask and Quix")
st.markdown("This dashboard reads from a table via an API, which is being continuously updated by a Quix Streams sink process running in Docker. It then displays a dynamically updating Plotly chart and table underneath.")
st.markdown("In the backend, there are services that:\n * Read from the GitHub Firehose \n * Stream the event data to Redpanda\n * Read from Redpanda and aggregate the events per GitHub user\n * Sinking the page event counts (which are continuously updating) to PostGres\n\n ")
st.markdown("Take a closer a look at the [back-end code](https://github.com/quixio/template-streamlit-rt-githubdash), and learn how to read from a real-time source and apply some kind of transformation to the data before bringing it into Streamlit (using only Python)")

# Placeholder for the bar chart and table
chart_placeholder = st.empty()
table_placeholder = st.empty()

# Placeholder for countdown text
countdown_placeholder = st.empty()

# Main loop
while True:
   # Get the data
   df = get_cached_data()

   # Check that data is being retrieved and passed correctly
   if df.empty:
       st.error("No data found. Please check your data source.")
       break

   # Calculate dynamic min and max scales
   min_count = df['event_count'].min()
   max_count = df['event_count'].max()
   min_scale = min_count * 0.99
   max_scale = max_count * 1.01

   # Create a Plotly figure
   fig = px.bar(df, x='displayname', y='event_count', title="Current Top 10 active GitHub Users by event count",
                range_y=[min_scale, max_scale])

   # Style the chart
   fig.update_layout(
       xaxis_title="Display Name",
       yaxis_title="Event Count",
       xaxis=dict(tickangle=-90)  # Vertical label orientation
   )

   # Display the Plotly chart in Streamlit using st.plotly_chart
   chart_placeholder.plotly_chart(fig, use_container_width=True)

   # Display the dataframe as a table
   table_placeholder.table(df)

   # Countdown
   for i in range(1, 0, -1):
       countdown_placeholder.text(f"Refreshing in {i} seconds...")
       time.sleep(1)

   # Clear the countdown text
   countdown_placeholder.empty()

   # Clear the cache to fetch new data
   get_cached_data.clear()
This Streamlit app polls the API every second to fetch the latest data. It then displays this data in a dynamically updating bar chart and table. The @st.cache_data decorator is used to cache the data, reducing the load on the API.
The Data API
The API, built with Flask, serves as the gateway to our data. This code sets up a simple Flask API that queries a PostgreSQL database and returns the results as JSON. We’re using the psycopg2 library to interact with the database and Flask to define an API route.
import os
from flask import Flask, jsonify
from waitress import serve
import psycopg2
import logging

from dotenv import load_dotenv
load_dotenv() ### for local dev, outside of docker, load env vars from a .env file

logging.basicConfig(level=logging.INFO)
logger = logging.getLogger(__name__)

app = Flask(__name__)

# Replace with your PostgreSQL connection details
pg_host = os.environ['PG_HOST']
pg_port = os.getenv('PG_PORT','5432')
pg_db = os.environ['PG_DATABASE']
pg_user = os.environ['PG_USER']
pg_password = os.environ['PG_PASSWORD']
pg_table = os.environ['PG_TABLE']

# Establish a connection to PostgreSQL
conn = psycopg2.connect(
   host=pg_host,
   port=pg_port,
   database=pg_db,
   user=pg_user,
   password=pg_password
)

@app.route('/events', methods=['GET'])
def get_user_events():
   query = f"SELECT * FROM {pg_table} ORDER BY event_count DESC LIMIT 10"

   logger.info(f"Running query: {query}")

   try:
       # Execute the query
       with conn.cursor() as cursor:
           cursor.execute(query)
           results = cursor.fetchall()
           columns = [desc[0] for desc in cursor.description]

       # Convert the result to a list of dictionaries
       results_list = [dict(zip(columns, row)) for row in results]
   except:
       logger.info(f"Error querying Postgres...")
       results_list = [{"error": "Database probably not ready yet."}]

   return jsonify(results_list)

if __name__ == '__main__':
   serve(app, host="0.0.0.0", port=80)
You can set up a much fancier API with query parameters and whatnot, but here I want to keep it simple. When an API request is received, just select the top 10 entries from the event_counts table and returns them as JSON. That’s it.
Why Use an API?
You might wonder why we use an API instead of querying the database directly from Streamlit. Here are a few reasons:
- Decoupling: By separating the data access layer from the presentation layer, you can easily swap out or upgrade components without affecting the entire system.
- Scalability: An API can handle multiple clients and can be scaled independently of the Streamlit app.
- Reusability: Other applications or services can use the same API to access the data.
Actually, while we’re on the subject of APIs, it’s about time for a digression on why all this back end stuff is good to know in the first place.
An intro to Quix Streams — the library that powers the streaming data layer
I know I said I wasn’t going to talk too much about the streaming data layer, but I want to quickly show you how it works, because it’s really not as complicated as you might think.
It uses one Python library — Quix Streams — to produce to Redpanda (our Kafka stand-in), consume from it, then do our aggregations. If you know Pandas, you’ll quickly get the hang of it, because it uses the concept of “streaming data frames” to manipulate data.
Here are some code snippets that demonstrate the basics of Quix Streams.
Connecting to Kafka (or any other Kafka-compatible message broker) and initializing data source and destination.
# Initialize a connection by providing a broker address
app = Application(broker_address="localhost:19092") # This is a basic example, are many other optional arguments

# Define a topic to read from and/or to produce to
input_topic = app.topic("raw_data")
output_topic = app.topic("processed_data")

# turn the incoming data into a Streaming Dataframe
sdf = app.dataframe(input_topic)
All of the services in the streaming data layer (Streaming Data Producer, Aggregation service, and the Postgres Writer) use these basic conventions to interact with Redpanda.
The aggregation service uses the following code to manipulate the data on-the-fly.
sdf = app.dataframe(input_topic)

# Get just the "actor" data out of the larger JSON message and use it as the new streaming dataframe
sdf = sdf.apply(
   lambda data: {
       "displayname": data['actor']['display_login'],
       "id": data['actor']['id']
   }
)

# Group (aka "Re-key") the streaming data by displayname so we can count the events
sdf = sdf.group_by("displayname")

# Counts the number of events by displayname
def count_messages(value: dict, state: State):
   current_total = state.get('event_count', default=0)
   current_total += 1
   state.set('event_count', current_total)
   return current_total

# Adds the message key (displayname) to the message body too (not that necessary, it's just for convenience)
def add_key_to_payload(value, key, timestamp, headers):
   value['displayname'] = key
   return value

# Start manipulating the streaming dataframe
sdf["event_count"] = sdf.apply(count_messages, stateful=True) # Apply the count function and initialize a state store (acts as like mini database that lets us track the counts per displayname), then store the results in an "event_count" column

sdf = sdf[["event_count"]] # Cut down our streaming dataframe to be JUST the event_count column

sdf = sdf.apply(add_key_to_payload, metadata=True) # Add the message key "displayname" as a column so that its easier to see what user each event count belongs to.

sdf = sdf.filter(lambda row: row['displayname'] not in ['github-actions', 'direwolf-github', 'dependabot']) # Filter out what looks like bot accounts from the list of displaynames

sdf = sdf.update(lambda row: print(f"Received row: {row}")) # Print each row so that we can see what we're going to send to the downstream topic

# Produce our processed streaming dataframe to the downstream topic "event_counts"
sdf = sdf.to_topic(output_topic)
As you can see, it’s very similar to manipulating data in Pandas, it’s just that it’s data on-the-move, and we’re interacting with topics rather than databases or CSV files.
Running the Python files outside of Docker
With Docker, we’ve simplified the setup process, so you can see how the pipeline works straight away. But you can also tinker with the Python files outside of Docker.
In fact, I’ve included a stripped down docker-compose file ‘docker-compose-rp-pg.yaml’ with just the non-Python services included (it’s simpler to keep running the Repanda broker and the PostgreSQL DB in Docker).
That way, you can easily run Redpanda and Postgres while you tinker with the Python files.
docker-compose down
To continue working with the Python files outside of Docker:
- Create a fresh virtual environment.
- Install the requirements (this requirements file is at the root of the tutorial repo: *
pip install -r requirements.txt
- If your containers from the previous steps are still running, take them down with:.
docker-compose down
- Start the Redpanda and Postgres servers by running the “stripped down” docker compose file instead:
docker-compose -f docker-compose-rp-pg.yaml up
Now you’re ready to experiment with the Python files and run the code directly in an IDE such as PyCharm.
The next challenge
Here’s your next challenge. Why not update the services to create a real-time “trending repos” report by counting the most active repos in a 30-min time window?
You can use the Quix Streams Windowed Aggregations as a reference. After all, who wants to see the trending repos just for a whole day? Attention spans are getting shorter -and the world is going real-time — we need minute-by-minute updates! Life just feels more exciting when the numbers change before our eyes.
As a reminder, you can find all the code files in this repo: https://github.com/quixio/template-streamlit-rt-githubdash
Now, go forth and impress your colleagues with amazing real-time dashboards!
PS: If you run into trouble, feel free to drop me a line in the Quix Community slack channel and I’ll do my best to help.
위 내용은 Python을 사용하여 실시간 GitHub 통계 대시보드 구축의 상세 내용입니다. 자세한 내용은 PHP 중국어 웹사이트의 기타 관련 기사를 참조하세요!

핫 AI 도구

Undresser.AI Undress
사실적인 누드 사진을 만들기 위한 AI 기반 앱

AI Clothes Remover
사진에서 옷을 제거하는 온라인 AI 도구입니다.

Undress AI Tool
무료로 이미지를 벗다

Clothoff.io
AI 옷 제거제

Video Face Swap
완전히 무료인 AI 얼굴 교환 도구를 사용하여 모든 비디오의 얼굴을 쉽게 바꾸세요!

인기 기사
뜨거운 도구

메모장++7.3.1
사용하기 쉬운 무료 코드 편집기

SublimeText3 중국어 버전
중국어 버전, 사용하기 매우 쉽습니다.

스튜디오 13.0.1 보내기
강력한 PHP 통합 개발 환경

드림위버 CS6
시각적 웹 개발 도구

SublimeText3 Mac 버전
신 수준의 코드 편집 소프트웨어(SublimeText3)


 Python vs. C : 학습 곡선 및 사용 편의성
Apr 19, 2025 am 12:20 AM
Python vs. C : 학습 곡선 및 사용 편의성
Apr 19, 2025 am 12:20 AM
Python은 배우고 사용하기 쉽고 C는 더 강력하지만 복잡합니다. 1. Python Syntax는 간결하며 초보자에게 적합합니다. 동적 타이핑 및 자동 메모리 관리를 사용하면 사용하기 쉽지만 런타임 오류가 발생할 수 있습니다. 2.C는 고성능 응용 프로그램에 적합한 저수준 제어 및 고급 기능을 제공하지만 학습 임계 값이 높고 수동 메모리 및 유형 안전 관리가 필요합니다.
 Python 학습 : 2 시간의 일일 연구가 충분합니까?
Apr 18, 2025 am 12:22 AM
Python 학습 : 2 시간의 일일 연구가 충분합니까?
Apr 18, 2025 am 12:22 AM
하루에 2 시간 동안 파이썬을 배우는 것으로 충분합니까? 목표와 학습 방법에 따라 다릅니다. 1) 명확한 학습 계획을 개발, 2) 적절한 학습 자원 및 방법을 선택하고 3) 실습 연습 및 검토 및 통합 연습 및 검토 및 통합,이 기간 동안 Python의 기본 지식과 고급 기능을 점차적으로 마스터 할 수 있습니다.
 Python vs. C : 성능과 효율성 탐색
Apr 18, 2025 am 12:20 AM
Python vs. C : 성능과 효율성 탐색
Apr 18, 2025 am 12:20 AM
Python은 개발 효율에서 C보다 낫지 만 C는 실행 성능이 높습니다. 1. Python의 간결한 구문 및 풍부한 라이브러리는 개발 효율성을 향상시킵니다. 2.C의 컴파일 유형 특성 및 하드웨어 제어는 실행 성능을 향상시킵니다. 선택할 때는 프로젝트 요구에 따라 개발 속도 및 실행 효율성을 평가해야합니다.
 Python vs. C : 주요 차이점 이해
Apr 21, 2025 am 12:18 AM
Python vs. C : 주요 차이점 이해
Apr 21, 2025 am 12:18 AM
Python과 C는 각각 고유 한 장점이 있으며 선택은 프로젝트 요구 사항을 기반으로해야합니다. 1) Python은 간결한 구문 및 동적 타이핑으로 인해 빠른 개발 및 데이터 처리에 적합합니다. 2) C는 정적 타이핑 및 수동 메모리 관리로 인해 고성능 및 시스템 프로그래밍에 적합합니다.
 Python Standard Library의 일부는 무엇입니까? 목록 또는 배열은 무엇입니까?
Apr 27, 2025 am 12:03 AM
Python Standard Library의 일부는 무엇입니까? 목록 또는 배열은 무엇입니까?
Apr 27, 2025 am 12:03 AM
Pythonlistsarepartoftsandardlardlibrary, whileraysarenot.listsarebuilt-in, 다재다능하고, 수집 할 수있는 반면, arraysarreprovidedByTearRaymoduledlesscommonlyusedDuetolimitedFunctionality.
 파이썬 : 자동화, 스크립팅 및 작업 관리
Apr 16, 2025 am 12:14 AM
파이썬 : 자동화, 스크립팅 및 작업 관리
Apr 16, 2025 am 12:14 AM
파이썬은 자동화, 스크립팅 및 작업 관리가 탁월합니다. 1) 자동화 : 파일 백업은 OS 및 Shutil과 같은 표준 라이브러리를 통해 실현됩니다. 2) 스크립트 쓰기 : PSUTIL 라이브러리를 사용하여 시스템 리소스를 모니터링합니다. 3) 작업 관리 : 일정 라이브러리를 사용하여 작업을 예약하십시오. Python의 사용 편의성과 풍부한 라이브러리 지원으로 인해 이러한 영역에서 선호하는 도구가됩니다.
 과학 컴퓨팅을위한 파이썬 : 상세한 모양
Apr 19, 2025 am 12:15 AM
과학 컴퓨팅을위한 파이썬 : 상세한 모양
Apr 19, 2025 am 12:15 AM
과학 컴퓨팅에서 Python의 응용 프로그램에는 데이터 분석, 머신 러닝, 수치 시뮬레이션 및 시각화가 포함됩니다. 1.numpy는 효율적인 다차원 배열 및 수학적 함수를 제공합니다. 2. Scipy는 Numpy 기능을 확장하고 최적화 및 선형 대수 도구를 제공합니다. 3. 팬더는 데이터 처리 및 분석에 사용됩니다. 4. matplotlib는 다양한 그래프와 시각적 결과를 생성하는 데 사용됩니다.
 웹 개발을위한 파이썬 : 주요 응용 프로그램
Apr 18, 2025 am 12:20 AM
웹 개발을위한 파이썬 : 주요 응용 프로그램
Apr 18, 2025 am 12:20 AM
웹 개발에서 Python의 주요 응용 프로그램에는 Django 및 Flask 프레임 워크 사용, API 개발, 데이터 분석 및 시각화, 머신 러닝 및 AI 및 성능 최적화가 포함됩니다. 1. Django 및 Flask 프레임 워크 : Django는 복잡한 응용 분야의 빠른 개발에 적합하며 플라스크는 소형 또는 고도로 맞춤형 프로젝트에 적합합니다. 2. API 개발 : Flask 또는 DjangorestFramework를 사용하여 RESTFULAPI를 구축하십시오. 3. 데이터 분석 및 시각화 : Python을 사용하여 데이터를 처리하고 웹 인터페이스를 통해 표시합니다. 4. 머신 러닝 및 AI : 파이썬은 지능형 웹 애플리케이션을 구축하는 데 사용됩니다. 5. 성능 최적화 : 비동기 프로그래밍, 캐싱 및 코드를 통해 최적화
