

Google Apps Script 및 Leaflet.js를 사용하여 대화형 XY 이미지 플롯 구축

Google Maps has a ton of features for plotting points on a map, but what if you want to plot points on an image? These XY Image Plot maps are commonly used for floor maps, job site inspections, and even games.
In this guide, I'll show you how to create an interactive map with draggable points using Leaflet.js and Google Apps Script. We'll cover everything from setting up the map to integrating data from Google Sheets, and deploying it as a web app.
This guide will cover:
Setting up Leaflet.js in a Google Apps Script HTML Service
Displaying Markers using data from Google Sheets
Updating Sheets row when a Marker is moved
Creating new Markers from the map and saving to Sheets
Deleting a marker from the web app
Setting up Leaflet.js in a Google Apps Script HTML Service
Leaflet.js is one of the most popular open-source mapping libraries. It's light-weight, easy to use, and had great documentation. They support a ton of different map types, including "CRS.Simple", or Coordinate Reference System, which allows you to supply a background image.
Google Sheets Set Up
Start out by creating a sheet named map_pin with the following structure:
| id | title | x | y |
|---|---|---|---|
| 1 | test1 | 10 | 30 |
| 2 | test2 | 50 | 80 |
그런 다음 확장 메뉴에서 Apps Script를 엽니다.
HTML 파일 생성
먼저 라이브러리를 작동시키기 위해 Leaflet 문서의 기본 예제부터 시작하겠습니다. 여기의 빠른 시작 가이드에서 전체 예를 볼 수 있습니다.
Index라는 새 HTML 파일을 추가하고 콘텐츠를 다음으로 설정합니다.
<!DOCTYPE html>
<html>
<head>
<title>Quick Start - Leaflet</title>
<meta charset="utf-8" />
<meta name="viewport" content="width=device-width, initial-scale=1.0">
<link rel="stylesheet" href="https://unpkg.com/leaflet@1.9.3/dist/leaflet.css" />
<style>
#map {
height: 400px;
}
</style>
</head>
<body>
<div id="map"></div>
<script src="https://unpkg.com/leaflet@1.9.3/dist/leaflet.js"></script>
<script>
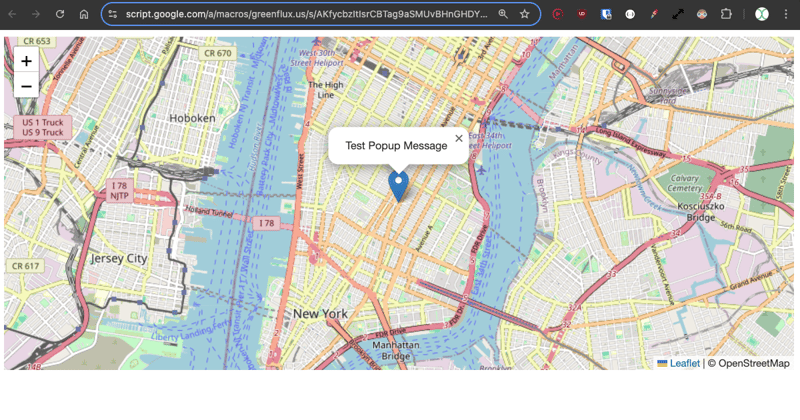
var map = L.map('map').setView([40.73, -73.99], 13);
L.tileLayer('https://{s}.tile.openstreetmap.org/{z}/{x}/{y}.png', {
maxZoom: 19,
attribution: '© OpenStreetMap'
}).addTo(map);
var marker = L.marker([40.73, -73.99]).addTo(map)
.bindPopup('Test Popup Message')
.openPopup();
</script>
</body>
</html>
그런 다음 Code.gs 파일을 다음으로 업데이트하세요.
function doGet() {
  const html = HtmlService.createHtmlOutputFromFile('Index')
    .setTitle('Map with Draggable Points')
    .setXFrameOptionsMode(HtmlService.XFrameOptionsMode.ALLOWALL);
  return html;
}
저장한 다음 배포를 클릭하고 웹 앱으로 게시하세요. 그런 다음 새 배포에 대한 링크를 열면 Leaflet.js가 뉴욕 지도를 표시하는 것을 볼 수 있습니다.
그럼 Leaflet을 사용한 일반 지도 예시입니다. 이제 배경 이미지를 제공할 수 있는 CRS.Simple 지도 유형을 살펴보겠습니다.
리플렛 튜토리얼의 예시로 HTML을 업데이트하세요.
<!DOCTYPE html>
<html>
<head>
<title>CRS Simple Example - Leaflet</title>
<meta charset="utf-8" />
<meta name="viewport" content="width=device-width, initial-scale=1.0">
<link rel="stylesheet" href="https://unpkg.com/leaflet@1.9.3/dist/leaflet.css" />
<style>
#map {
height: 400px;
width: 600px;
}
body {
margin: 0;
padding: 0;
}
</style>
</head>
<body>
<div id="map"></div>
<script src="https://unpkg.com/leaflet@1.9.3/dist/leaflet.js"></script>
<script>
// Set up the map with a simple CRS (no geographic projection)
var map = L.map('map', {
crs: L.CRS.Simple,
minZoom: -1,
maxZoom: 4
});
// Define the dimensions of the image
var bounds = [[0, 0], [1000, 1000]];
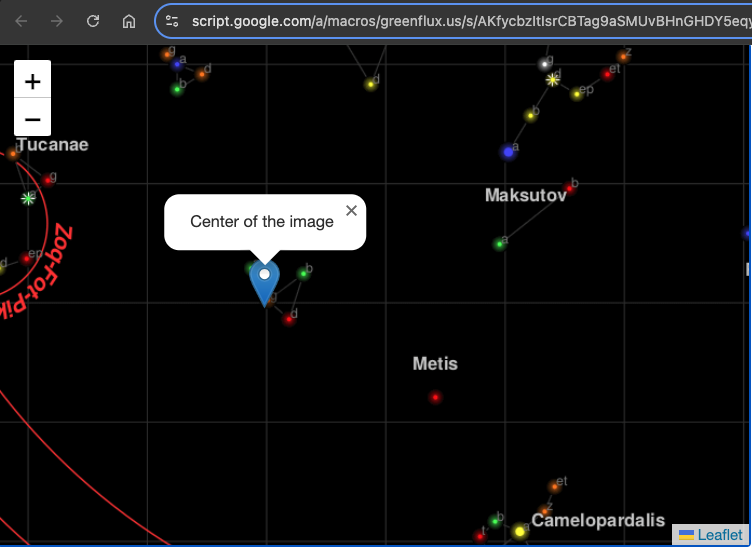
var image = L.imageOverlay('https://leafletjs.com/examples/crs-simple/uqm_map_full.png', bounds).addTo(map);
// Set the initial view of the map to show the whole image
map.fitBounds(bounds);
// Optional: Add a marker or other elements to the map
var marker = L.marker([500, 500]).addTo(map)
.bindPopup('Center of the image')
.openPopup();
</script>
</body>
</html>
여기에서는 1000 x 1000픽셀의 이미지를 제공하고 중앙 마커를 500, 500으로 설정합니다.
저장을 클릭한 다음 배포>배포 테스트를 클릭하여 새 지도 유형을 확인하세요. 이제 배경 이미지가 있는 지도와 중앙에 마커가 표시됩니다.
Google 스프레드시트의 데이터로 지도 초기화
다음으로 시트의 데이터를 사용하여 지도에 일련의 마커를 채웁니다.
먼저 Code.gs 파일에 함수를 추가하여 마커 위치를 가져옵니다.
function getPinData(){
  const ss = SpreadsheetApp.getActiveSpreadsheet();
  const sh = ss.getSheetByName('map_pin');
  const data = sh.getDataRange().getValues();
  const json = arrayToJSON(data);
  //Logger.log(json);
  return json
}

function arrayToJSON(data=getPinData()){
  const headers = data[0];
  const rows = data.slice(1);
  let jsonData = [];
  for(row of rows){
    const obj = {};
    headers.forEach((h,i)=>obj[h] = row[i]);
    jsonData.push(obj)
  }
  //Logger.log(jsonData)
  return jsonData
}
다음 섹션의 HTML에서 더 쉽게 작업할 수 있도록 핀을 JSON으로 반환합니다.
이제 이 JSON을 반복하고 지도가 로드된 후 지도 핀을 생성하는 함수를 HTML에 추가하세요.
// Add map pins from sheet data
    google.script.run.withSuccessHandler(addMarkers).getPinData();

    function addMarkers(mapPinData) {
      mapPinData.forEach(pin => {
        const marker = L.marker([pin.x, pin.y], {
          draggable: true
        }).addTo(map);

        marker.bindPopup(`<b>${pin.title}`).openPopup();

        marker.on('dragend', function(e) {
          const latLng = e.target.getLatLng();
          console.log(`Marker ${pin.title} moved to: ${latLng.lat}, ${latLng.lng}`);
        });
      });
    }
저장한 다음 테스트 배포를 엽니다. 이제 시트 데이터에서 마커가 생성되었습니다!
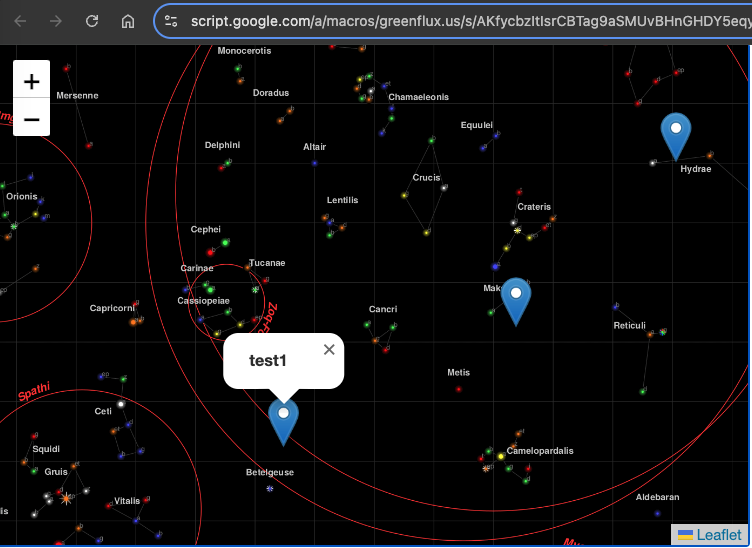
각 핀에는 해당 행의 제목이 포함된 팝업이 있습니다. 이 시점에서 핀을 드래그할 수 있지만 새 위치를 저장하는 기능이 여전히 필요합니다.
드래그 시 마커 위치 저장
새 위치를 저장하려면 클라이언트 측에서 이벤트를 캡처하는 HTML 함수와 서버 측 Code.gs 파일에 새 위치를 저장하는 함수 두 가지가 필요합니다.
다음을 사용하여 HTML을 업데이트하세요.
    function addMarkers(mapPinData) {
      mapPinData.forEach(pin => {
        const { id, title, x, y } = pin;
        const marker = L.marker([x, y], {
          draggable: true
        }).addTo(map);

        marker.bindPopup(`<b>${title}</b>`).openPopup();

        marker.on('dragend', function(e) {
          const latLng = e.target.getLatLng();
          console.log(`Marker ${title} moved to: ${latLng.lat}, ${latLng.lng}`);
          saveMarkerPosition({ id, title, lat: latLng.lat, lng: latLng.lng });
        });
      });
    }

    function saveMarkerPosition({ id, title, lat, lng }) {
      google.script.run.saveMarkerPosition({ id, title, lat, lng });
    }
그런 다음 Code.gs 파일에 함수를 추가하여 위치를 저장합니다.
function saveMarkerPosition({ id, lat, lng }) {
  const ss = SpreadsheetApp.getActiveSpreadsheet();
  const sh = ss.getSheetByName('map_pin');
  const data = sh.getDataRange().getValues();

  for (let i = 1; i < data.length; i++) {
    if (data[i][0] === id) {  // ID column (index 0)
      sh.getRange(i + 1, 3).setValue(lat);  // latitude column
      sh.getRange(i + 1, 4).setValue(lng);  // longitude column
      break;
    }
  }
}
테스트 배포를 저장하고 새로 고칩니다. 이제 마커를 드래그하면 시트 업데이트가 표시됩니다!
새 포인트 추가
이제 기존 포인트를 이동할 수 있지만 새 포인트를 추가하는 것은 어떨까요? 이번에도 HTML과 Code.gs 파일에 각각 하나씩 두 개의 함수가 필요합니다.
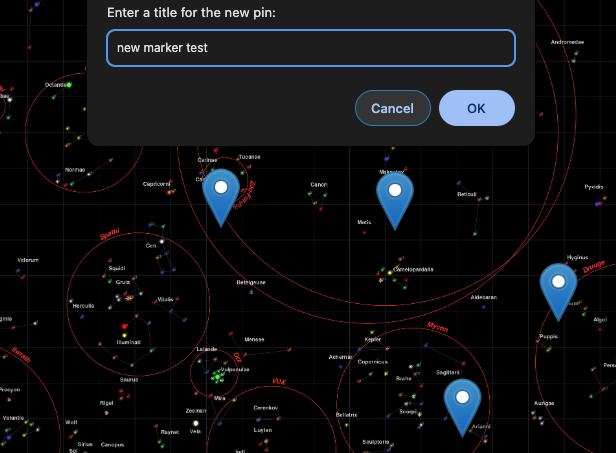
먼저 사용자가 지도의 빈 곳을 클릭하면 프롬프트가 열리는 함수를 HTML에 추가하고 해당 값을 서버 함수에 전달합니다.
    // Function to add a new pin
    map.on('click', function(e) {
      const latLng = e.latlng;
      const title = prompt('Enter a title for the new pin:');
      if (title) {
        google.script.run.withSuccessHandler(function(id) {
          addNewMarker({ id, title, lat: latLng.lat, lng: latLng.lng });
        }).addNewPin({ title, lat: latLng.lat, lng: latLng.lng });
      }
    });

    function addNewMarker({ id, title, lat, lng }) {
      const marker = L.marker([lat, lng], {
        draggable: true
      }).addTo(map);

      marker.bindPopup(`<b>${title}</b>`).openPopup();

      marker.on('dragend', function(e) {
        const latLng = e.target.getLatLng();
        saveMarkerPosition({ id, title, lat: latLng.lat, lng: latLng.lng });
      });
    }
그런 다음 Code.gs에 함수를 추가하여 새 행을 저장하세요.
function addNewPin({ title, lat, lng }) {
  const ss = SpreadsheetApp.getActiveSpreadsheet();
  const sh = ss.getSheetByName('map_pin');

  // Check if there are any rows present, if not initialize ID
  const lastRow = sh.getLastRow();
  let newId = 1;

  if (lastRow > 0) {
    const lastId = sh.getRange(lastRow, 1).getValue();
    newId = lastId + 1;
  }

  sh.appendRow([newId, title, lat, lng]);

  return newId;
}
한 번 더 저장하고 테스트 배포를 새로 고칩니다. 이제 빈 곳을 클릭하면 제목을 입력하고 새 마커를 저장할 수 있습니다!
마커 삭제
마지막으로 마커를 삭제하는 방법을 추가하여 지도 보기에서 완전한 CRUD 앱을 제공해야 합니다.
팝업에 삭제 버튼을 제공하도록 마커 추가 기능을 업데이트하세요.
      const popupContent = `<b>${title}</b><br><button onclick="deleteMarker(${id})">Delete Marker</button>`;
      marker.bindPopup(popupContent).openPopup();
그런 다음 클라이언트 측에서 삭제하는 기능을 추가합니다.
// Function to delete a marker
  function deleteMarker(id) {
    const confirmed = confirm('Are you sure you want to delete this marker?');
    if (confirmed) {
      google.script.run.withSuccessHandler(() => {
        // Refresh the markers after deletion
        google.script.run.withSuccessHandler(addMarkers).getPinData();
      }).deleteMarker(id);
    }
  }
그런 다음 Code.gs 파일에 일치 함수를 추가합니다.
function deleteMarker(id) {
  const ss = SpreadsheetApp.getActiveSpreadsheet();
  const sh = ss.getSheetByName('map_pin');
  const data = sh.getDataRange().getValues();

  for (let i = 1; i < data.length; i++) {
    if (data[i][0] === id) {  // ID column (index 0)
      sh.deleteRow(i + 1);  // Delete the row
      break;
    }
  }
}
다음은 무엇입니까?
각 마커에 다른 데이터 포인트 추가, 동적 배경 이미지, 기타 클릭 및 드래그 상호 작용 등 여기에서 더 많은 작업을 수행할 수 있습니다. 게임을 만들 수도 있어요! 사용 사례에 대한 아이디어가 있나요? 아래에 댓글을 남겨주세요!
위 내용은 Google Apps Script 및 Leaflet.js를 사용하여 대화형 XY 이미지 플롯 구축의 상세 내용입니다. 자세한 내용은 PHP 중국어 웹사이트의 기타 관련 기사를 참조하세요!

핫 AI 도구

Undresser.AI Undress
사실적인 누드 사진을 만들기 위한 AI 기반 앱

AI Clothes Remover
사진에서 옷을 제거하는 온라인 AI 도구입니다.

Undress AI Tool
무료로 이미지를 벗다

Clothoff.io
AI 옷 제거제

Video Face Swap
완전히 무료인 AI 얼굴 교환 도구를 사용하여 모든 비디오의 얼굴을 쉽게 바꾸세요!

인기 기사
뜨거운 도구

메모장++7.3.1
사용하기 쉬운 무료 코드 편집기

SublimeText3 중국어 버전
중국어 버전, 사용하기 매우 쉽습니다.

스튜디오 13.0.1 보내기
강력한 PHP 통합 개발 환경

드림위버 CS6
시각적 웹 개발 도구

SublimeText3 Mac 버전
신 수준의 코드 편집 소프트웨어(SublimeText3)
뜨거운 주제
 7886
7886
 15
1649
14
1410
52
1301
25
1246
29
15
1649
14
1410
52
1301
25
1246
29

 프론트 엔드 열 용지 영수증에 대한 차량 코드 인쇄를 만나면 어떻게해야합니까?
Apr 04, 2025 pm 02:42 PM
프론트 엔드 열 용지 영수증에 대한 차량 코드 인쇄를 만나면 어떻게해야합니까?
Apr 04, 2025 pm 02:42 PM
프론트 엔드 개발시 프론트 엔드 열지대 티켓 인쇄를위한 자주 묻는 질문과 솔루션, 티켓 인쇄는 일반적인 요구 사항입니다. 그러나 많은 개발자들이 구현하고 있습니다 ...
 Demystifying JavaScript : 그것이하는 일과 중요한 이유
Apr 09, 2025 am 12:07 AM
Demystifying JavaScript : 그것이하는 일과 중요한 이유
Apr 09, 2025 am 12:07 AM
JavaScript는 현대 웹 개발의 초석이며 주요 기능에는 이벤트 중심 프로그래밍, 동적 컨텐츠 생성 및 비동기 프로그래밍이 포함됩니다. 1) 이벤트 중심 프로그래밍을 사용하면 사용자 작업에 따라 웹 페이지가 동적으로 변경 될 수 있습니다. 2) 동적 컨텐츠 생성을 사용하면 조건에 따라 페이지 컨텐츠를 조정할 수 있습니다. 3) 비동기 프로그래밍은 사용자 인터페이스가 차단되지 않도록합니다. JavaScript는 웹 상호 작용, 단일 페이지 응용 프로그램 및 서버 측 개발에 널리 사용되며 사용자 경험 및 크로스 플랫폼 개발의 유연성을 크게 향상시킵니다.
 누가 더 많은 파이썬이나 자바 스크립트를 지불합니까?
Apr 04, 2025 am 12:09 AM
누가 더 많은 파이썬이나 자바 스크립트를 지불합니까?
Apr 04, 2025 am 12:09 AM
기술 및 산업 요구에 따라 Python 및 JavaScript 개발자에 대한 절대 급여는 없습니다. 1. 파이썬은 데이터 과학 및 기계 학습에서 더 많은 비용을 지불 할 수 있습니다. 2. JavaScript는 프론트 엔드 및 풀 스택 개발에 큰 수요가 있으며 급여도 상당합니다. 3. 영향 요인에는 경험, 지리적 위치, 회사 규모 및 특정 기술이 포함됩니다.
 JavaScript는 배우기가 어렵습니까?
Apr 03, 2025 am 12:20 AM
JavaScript는 배우기가 어렵습니까?
Apr 03, 2025 am 12:20 AM
JavaScript를 배우는 것은 어렵지 않지만 어려운 일입니다. 1) 변수, 데이터 유형, 기능 등과 같은 기본 개념을 이해합니다. 2) 마스터 비동기 프로그래밍 및 이벤트 루프를 통해이를 구현하십시오. 3) DOM 운영을 사용하고 비동기 요청을 처리합니다. 4) 일반적인 실수를 피하고 디버깅 기술을 사용하십시오. 5) 성능을 최적화하고 모범 사례를 따르십시오.
 Shiseido의 공식 웹 사이트와 같은 시차 스크롤 및 요소 애니메이션 효과를 달성하는 방법은 무엇입니까?
또는:
Shiseido의 공식 웹 사이트와 같은 페이지 스크롤과 함께 애니메이션 효과를 어떻게 달성 할 수 있습니까?
Apr 04, 2025 pm 05:36 PM
Shiseido의 공식 웹 사이트와 같은 시차 스크롤 및 요소 애니메이션 효과를 달성하는 방법은 무엇입니까?
또는:
Shiseido의 공식 웹 사이트와 같은 페이지 스크롤과 함께 애니메이션 효과를 어떻게 달성 할 수 있습니까?
Apr 04, 2025 pm 05:36 PM
이 기사에서 시차 스크롤 및 요소 애니메이션 효과 실현에 대한 토론은 Shiseido 공식 웹 사이트 (https://www.shiseido.co.jp/sb/wonderland/)와 유사하게 달성하는 방법을 살펴볼 것입니다.
 JavaScript의 진화 : 현재 동향과 미래 전망
Apr 10, 2025 am 09:33 AM
JavaScript의 진화 : 현재 동향과 미래 전망
Apr 10, 2025 am 09:33 AM
JavaScript의 최신 트렌드에는 Typescript의 Rise, 현대 프레임 워크 및 라이브러리의 인기 및 WebAssembly의 적용이 포함됩니다. 향후 전망은보다 강력한 유형 시스템, 서버 측 JavaScript 개발, 인공 지능 및 기계 학습의 확장, IoT 및 Edge 컴퓨팅의 잠재력을 포함합니다.
 JavaScript를 사용하여 동일한 ID와 동일한 ID로 배열 요소를 하나의 객체로 병합하는 방법은 무엇입니까?
Apr 04, 2025 pm 05:09 PM
JavaScript를 사용하여 동일한 ID와 동일한 ID로 배열 요소를 하나의 객체로 병합하는 방법은 무엇입니까?
Apr 04, 2025 pm 05:09 PM
동일한 ID로 배열 요소를 JavaScript의 하나의 객체로 병합하는 방법은 무엇입니까? 데이터를 처리 할 때 종종 동일한 ID를 가질 필요가 있습니다 ...
 Console.log 출력 결과의 차이 : 두 통화가 다른 이유는 무엇입니까?
Apr 04, 2025 pm 05:12 PM
Console.log 출력 결과의 차이 : 두 통화가 다른 이유는 무엇입니까?
Apr 04, 2025 pm 05:12 PM
Console.log 출력의 차이의 근본 원인에 대한 심층적 인 논의. 이 기사에서는 Console.log 함수의 출력 결과의 차이점을 코드에서 분석하고 그에 따른 이유를 설명합니다. � ...
