
참고: 이 게시물에서는 쉽게 따라할 수 있도록 회색조 이미지만 사용합니다.
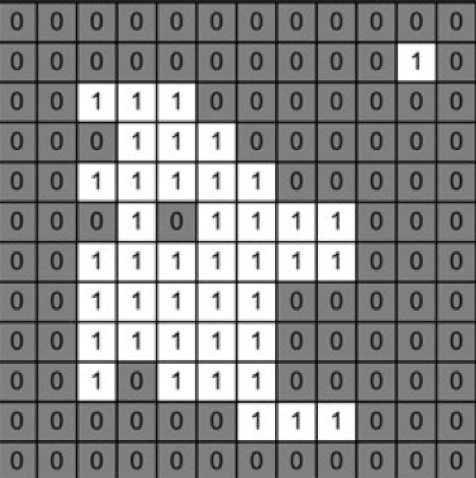
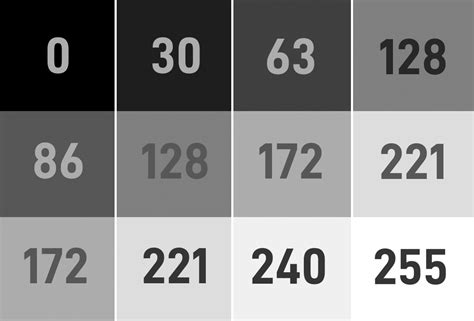
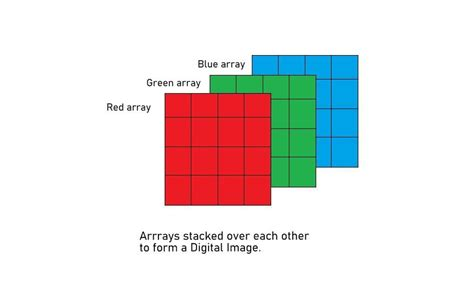
이미지는 값의 행렬로 생각할 수 있으며, 각 값은 픽셀의 강도를 나타냅니다. 이미지 형식에는 세 가지 주요 유형이 있습니다.
필터는 특정 작업을 적용하여 이미지를 수정하는 데 사용되는 도구입니다. 필터는 이미지를 가로질러 이동하면서 해당 창 내의 픽셀 값에 대해 계산을 수행하는 행렬(커널이라고도 함)입니다. 우리는 두 가지 일반적인 필터 유형, 즉 평균 필터와 중앙값 필터를 다룰 것입니다.
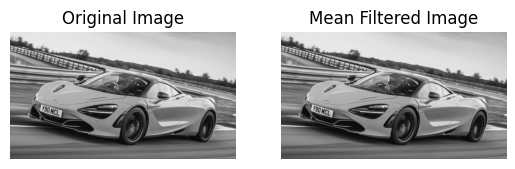
평균 필터는 창 내의 픽셀 값을 평균화하여 노이즈를 줄이는 데 사용됩니다. 창의 중앙 픽셀을 해당 창 내의 모든 픽셀 값의 평균으로 바꿉니다. cv2.blur() 함수는 커널 크기가 3x3인 평균 필터를 적용합니다. 이는 평균을 계산하기 위해 각 픽셀 주위의 픽셀의 3x3 창을 고려한다는 의미입니다. 이미지를 부드럽게 만드는 데 도움이 됩니다.
import cv2
import matplotlib.pyplot as plt

image = cv2.imread('McLaren-720S-Price-1200x675.jpg', cv2.IMREAD_GRAYSCALE)

# Applies a Mean Filter of size 3 x 3
blurred_image = cv2.blur(image, (3, 3))

plt.subplot(1, 2, 1)
plt.imshow(image, cmap='gray')
plt.title('Original Image')
plt.axis("off")

plt.subplot(1, 2, 2)
plt.imshow(blurred_image, cmap='gray')
plt.title('Mean Filtered Image')
plt.axis("off")
plt.show()
중앙값 필터는 각 픽셀의 값을 창에 있는 모든 픽셀의 중앙값으로 대체하여 노이즈를 줄이는 데 사용됩니다. 이는 소금과 후추 소음을 제거하는 데 특히 효과적입니다. cv2.medianBlur() 함수는 커널 크기가 3인 중앙값 필터를 적용합니다. 이 메서드는 각 픽셀을 인접 픽셀 값의 중앙값으로 대체하므로 노이즈를 제거하는 동시에 가장자리를 유지하는 데 도움이 됩니다. 여기서 커널 크기가 클수록 이미지가 더 흐려집니다.
import cv2
import matplotlib.pyplot as plt

image = cv2.imread('McLaren-720S-Price-1200x675.jpg', cv2.IMREAD_GRAYSCALE)

# Applies a Median Filter with a kernel size of 3
blurred_image = cv2.medianBlur(image, 3)

plt.subplot(1, 2, 1)
plt.imshow(image, cmap='gray')
plt.title('Original Image')
plt.axis("off")

plt.subplot(1, 2, 2)
plt.imshow(blurred_image, cmap='gray')
plt.title('Median Filtered Image')
plt.axis("off")
plt.show()

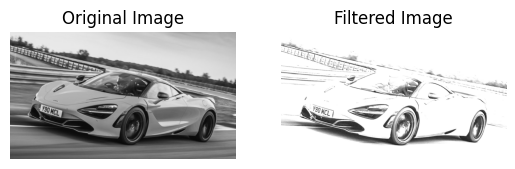
맞춤 필터를 만들어 이미지에 특정 작업을 적용할 수 있습니다. cv2.filter2D() 함수를 사용하면 사용자 정의 커널을 이미지에 적용할 수 있습니다. cv2.filter2D() 함수는 이미지에 사용자 정의 커널(필터)을 적용합니다. 커널은 픽셀 값에 대해 수행할 작업을 정의하는 행렬입니다. 이 예에서 커널은 지정된 값을 기반으로 이미지의 특정 기능을 향상시킵니다.
import cv2
import numpy as np
import matplotlib.pyplot as plt

image = cv2.imread('McLaren-720S-Price-1200x675.jpg', cv2.IMREAD_GRAYSCALE)

# Define a custom filter kernel
kernel = np.array([[2, -1, 5],
                   [-5, 5, -1],
                   [0, -1, 0]])

filtered_image = cv2.filter2D(image, -1, kernel)

plt.subplot(1, 2, 1)
plt.imshow(image, cmap='gray')
plt.title('Original Image')
plt.axis('off')

plt.subplot(1, 2, 2)
plt.imshow(filtered_image, cmap='gray')
plt.title('Filtered Image')
plt.axis('off')

plt.show()
참고: 코드 조각에서 임계값 이미지를 할당할 때 _ , 이미지가 표시됩니다. 이는 cv2.threshold 함수가 사용된 임계값과 임계값 이미지라는 두 가지 값을 반환하기 때문입니다. 임계값 이미지만 필요하므로 _를 사용하여 임계값을 무시합니다.
임계값은 조건에 따라 픽셀 값을 설정하여 이미지를 이진 이미지로 변환합니다. 임계값 기술에는 여러 유형이 있습니다.
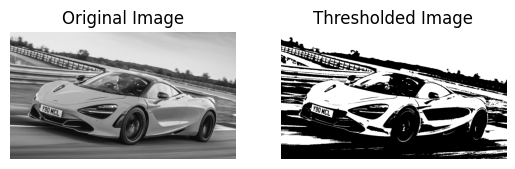
이 방법은 전체 이미지에 대해 고정된 임계값을 설정합니다. 임계값보다 높은 값을 갖는 픽셀은 최대값(255)으로 설정되고, 그 이하는 0으로 설정됩니다. 간단한 임계값 지정에는 cv2.threshold() 함수가 사용됩니다. 명암도가 127보다 큰 픽셀은 흰색(255)으로 설정되고, 명도가 127 이하인 픽셀은 검정색(0)으로 설정되어 이진 이미지를 생성합니다.
import cv2
import matplotlib.pyplot as plt

image = cv2.imread('McLaren-720S-Price-1200x675.jpg', cv2.IMREAD_GRAYSCALE)

_, thresholded_image = cv2.threshold(image, 127, 255, cv2.THRESH_BINARY)

plt.subplot(1, 2, 1)
plt.imshow(image, cmap='gray')
plt.title('Original Image')
plt.axis("off")

plt.subplot(1, 2, 2)
plt.imshow(thresholded_image, cmap='gray')
plt.title('Thresholded Image')
plt.axis("off")
plt.show()
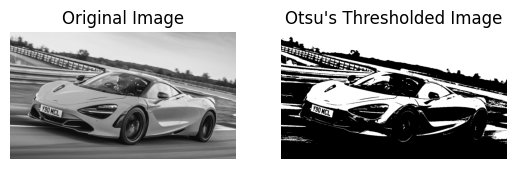
Otsu's method determines the optimal threshold value automatically based on the histogram of the image. This method minimizes intra-class variance and maximizes inter-class variance. By setting the threshold value to 0 and using cv2.THRESH_OTSU, the function automatically calculates the best threshold value to separate the foreground from the background.
import cv2
import matplotlib.pyplot as plt

image = cv2.imread('McLaren-720S-Price-1200x675.jpg', cv2.IMREAD_GRAYSCALE)

_, otsu_thresholded_image = cv2.threshold(image, 0, 255, cv2.THRESH_BINARY + cv2.THRESH_OTSU)

plt.subplot(1, 2, 1)
plt.imshow(image, cmap='gray')
plt.title('Original Image')
plt.axis("off")

plt.subplot(1, 2, 2)
plt.imshow(otsu_thresholded_image, cmap='gray')
plt.title("Otsu's Thresholded Image")
plt.axis("off")
plt.show()
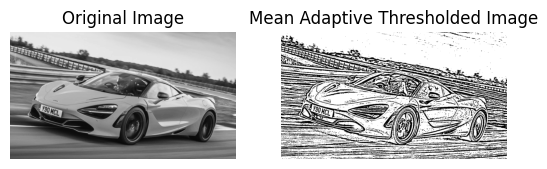
In Mean Adaptive Thresholding, the threshold value for each pixel is calculated based on the average of pixel values in a local neighborhood around that pixel. This method adjusts the threshold dynamically across different regions of the image. The cv2.adaptiveThreshold() function calculates the threshold for each pixel based on the mean value of the pixel values in a local 11x11 neighborhood. A constant value of 2 is subtracted from this mean to fine-tune the threshold. This method is effective for images with varying lighting conditions.
import cv2
import matplotlib.pyplot as plt

image = cv2.imread('McLaren-720S-Price-1200x675.jpg', cv2.IMREAD_GRAYSCALE)

mean_adaptive_thresholded_image = cv2.adaptiveThreshold(image, 255, cv2.ADAPTIVE_THRESH_MEAN_C, cv2.THRESH_BINARY, 11, 2)

plt.subplot(1, 2, 1)
plt.imshow(image, cmap='gray')
plt.title('Original Image')
plt.axis("off")

plt.subplot(1, 2, 2)
plt.imshow(mean_adaptive_thresholded_image, cmap='gray')
plt.title('Mean Adaptive Thresholded Image')
plt.axis("off")
plt.show()
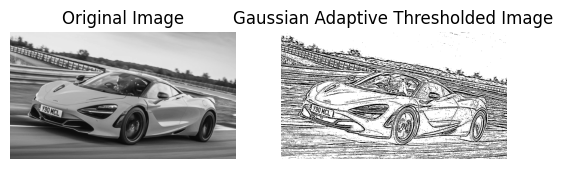
Gaussian Adaptive Thresholding computes the threshold value for each pixel based on a Gaussian-weighted sum of the pixel values in a local neighborhood. This method often provides better results in cases with non-uniform illumination. In Gaussian Adaptive Thresholding, the threshold is determined by a Gaussian-weighted sum of pixel values in an 11x11 neighborhood. The constant value 2 is subtracted from this weighted mean to adjust the threshold. This method is useful for handling images with varying lighting and shadows.
import cv2
import matplotlib.pyplot as plt

image = cv2.imread('McLaren-720S-Price-1200x675.jpg', cv2.IMREAD_GRAYSCALE)

gaussian_adaptive_thresholded_image = cv2.adaptiveThreshold(image, 255, cv2.ADAPTIVE_THRESH_GAUSSIAN_C, cv2.THRESH_BINARY, 11, 2)

plt.subplot(1, 2, 1)
plt.imshow(image, cmap='gray')
plt.title('Original Image')
plt.axis("off")

plt.subplot(1, 2, 2)
plt.imshow(gaussian_adaptive_thresholded_image, cmap='gray')
plt.title('Gaussian Adaptive Thresholded Image')
plt.axis("off")
plt.show()
위 내용은 Python을 사용한 컴퓨터 비전 소개(1부)의 상세 내용입니다. 자세한 내용은 PHP 중국어 웹사이트의 기타 관련 기사를 참조하세요!


![[웹 프런트엔드] Node.js 빠른 시작](https://img.php.cn/upload/course/000/000/067/662b5d34ba7c0227.png)


