
Snowflake에서는 Snowflake Copilot이라는 LLM 보조 기능을 미리보기 기능으로 출시했습니다. Snowflake Copilot을 사용하면 자연어를 활용하여 테이블 데이터를 분석할 수 있습니다.
반면에 Streamlit in Snowflake(SiS)를 사용하면 생성 AI를 쉽게 통합하고 테이블 데이터에 안전하게 액세스할 수 있습니다. 이로 인해 저는 다음과 같은 생각을 하게 되었습니다. 보다 적극적인 자연어 데이터 분석 도구를 만들 수는 없을까? 그래서 자연어를 활용하여 데이터를 분석하고 시각화할 수 있는 앱을 개발했습니다.
참고: 이 게시물은 Snowflake의 의견이 아닌 개인적인 견해를 나타냅니다.
다음은 Cortex LLM(snowflake-arctic)을 이용한 분석 결과를 발췌한 것입니다.

참고: 이 와인 품질 데이터세트를 사용했습니다.
from snowflake.snowpark.context import get_active_session
import streamlit as st
from snowflake.cortex import Complete as CompleteText
import snowflake.snowpark.functions as F
import pandas as pd
import numpy as np
import json
import plotly.express as px
# Get current session
session = get_active_session()
# Application title
st.title("Natural Language Data Analysis App")
# Cortex LLM settings
st.sidebar.title("Cortex LLM Settings")
lang_model = st.sidebar.radio("Select the language model you want to use",
("snowflake-arctic", "reka-flash", "reka-core",
"mistral-large2", "mistral-large", "mixtral-8x7b", "mistral-7b",
"llama3.1-405b", "llama3.1-70b", "llama3.1-8b",
"llama3-70b", "llama3-8b", "llama2-70b-chat",
"jamba-instruct", "gemma-7b")
)
# Function to escape column names
def escape_column_name(name):
return f'"{name}"'
# Function to get table information
def get_table_info(database, schema, table):
# Get column information
columns = session.sql(f"DESCRIBE TABLE {database}.{schema}.{table}").collect()
# Create DataFrame
column_df = pd.DataFrame(columns)
# Get row count
row_count = session.sql(f"SELECT COUNT(*) as count FROM {database}.{schema}.{table}").collect()[0]['COUNT']
# Get sample data
sample_data = session.sql(f"SELECT * FROM {database}.{schema}.{table} LIMIT 5").collect()
sample_df = pd.DataFrame(sample_data)
return column_df, row_count, sample_df
# Data analysis function
def analyze(df, query):
st.subheader("Result Analysis")
# Display basic statistical information
st.subheader("Basic Statistics")
st.write(df.describe())
# Use AI for data analysis
analysis_prompt = f"""
Based on the following dataframe and original question, please perform data analysis.
Concisely explain in English the insights, trends, and anomalies derived from the data.
If possible, please also mention the following points:
1. Data distribution and characteristics
2. Presence of abnormal values or outliers
3. Correlations between columns (if there are multiple numeric columns)
4. Time-series trends (if there is date or time data)
5. Category-specific features (if data can be divided by categories)
Dataframe:
{df.to_string()}
Original question:
{query}
"""
analysis = CompleteText(lang_model, analysis_prompt)
st.write(analysis)
# Data visualization function
def smart_data_visualization(df):
st.subheader("Smart Data Visualization")
if df.empty:
st.warning("The dataframe is empty. There is no data to visualize.")
return
# Request AI for graph suggestion
columns_info = "\n".join([f"{col} - type: {df[col].dtype}" for col in df.columns])
sample_data = df.head().to_string()
visualization_prompt = f"""
Analyze the information of the following dataframe and suggest the most appropriate graph type and the columns to use for its x-axis and y-axis.
Consider the characteristics of the data to ensure a meaningful visualization.
Column information:
{columns_info}
Sample data:
{sample_data}
Please provide only the following JSON data format as your response:
{{
"graph_type": "One of: scatter plot, bar chart, line chart, histogram, box plot",
"x_axis": "Column name to use for x-axis",
"y_axis": "Column name to use for y-axis (if applicable)",
"explanation": "Brief explanation of the selection reason"
}}
"""
ai_suggestion = CompleteText(lang_model, visualization_prompt)
try:
suggestion = json.loads(ai_suggestion)
graph_type = suggestion['graph_type']
x_axis = suggestion['x_axis']
y_axis = suggestion.get('y_axis') # y-axis might not be needed in some cases
explanation = suggestion['explanation']
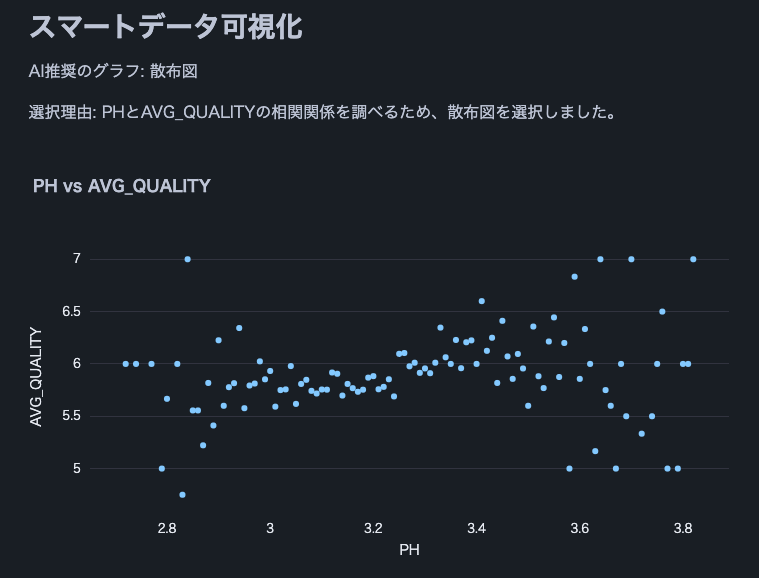
st.write(f"AI recommended graph: {graph_type}")
st.write(f"Selection reason: {explanation}")
if graph_type == "scatter plot":
fig = px.scatter(df, x=x_axis, y=y_axis, title=f"{x_axis} vs {y_axis}")
elif graph_type == "bar chart":
fig = px.bar(df, x=x_axis, y=y_axis, title=f"{y_axis} by {x_axis}")
elif graph_type == "line chart":
fig = px.line(df, x=x_axis, y=y_axis, title=f"{y_axis} over {x_axis}")
elif graph_type == "histogram":
fig = px.histogram(df, x=x_axis, title=f"Distribution of {x_axis}")
elif graph_type == "box plot":
fig = px.box(df, x=x_axis, y=y_axis, title=f"Distribution of {y_axis} by {x_axis}")
else:
st.warning(f"Unsupported graph type: {graph_type}")
return
st.plotly_chart(fig)
except json.JSONDecodeError:
st.error("Failed to parse AI suggestion. Please try again.")
except KeyError as e:
st.error(f"AI suggestion is missing necessary information: {str(e)}")
except Exception as e:
st.error(f"An error occurred while creating the graph: {str(e)}")
# AI interpretation of visualization
visualization_interpretation_prompt = f"""
Based on the following dataset and created graph, please provide a detailed interpretation of the data trends and characteristics in English.
Point out possible insights, patterns, anomalies, or areas that require additional analysis.
Dataset information:
Columns: {', '.join(df.columns)}
Number of rows: {len(df)}
Created graph:
Type: {graph_type}
X-axis: {x_axis}
Y-axis: {y_axis if y_axis else 'None'}
"""
ai_interpretation = CompleteText(lang_model, visualization_interpretation_prompt)
st.subheader("AI Interpretation of the Graph")
st.write(ai_interpretation)
# Function to handle cases where AI response is not just SQL query
def clean_sql_query(query):
# Remove leading and trailing whitespace
query = query.strip()
# If not starting with SQL keywords, remove everything up to the first SELECT
if not query.upper().startswith(('SELECT')):
keywords = ['SELECT']
for keyword in keywords:
if keyword in query.upper():
query = query[query.upper().index(keyword):]
break
return query
# Function for natural language querying of DB
def data_analysis_and_natural_language_query():
# Database selection
databases = session.sql("SHOW DATABASES").collect()
database_names = [row['name'] for row in databases]
selected_database = st.selectbox("Select a database", database_names)
if selected_database:
# Schema selection
schemas = session.sql(f"SHOW SCHEMAS IN DATABASE {selected_database}").collect()
schema_names = [row['name'] for row in schemas]
selected_schema = st.selectbox("Select a schema", schema_names)
if selected_schema:
# Table selection
tables = session.sql(f"SHOW TABLES IN {selected_database}.{selected_schema}").collect()
table_names = [row['name'] for row in tables]
selected_table = st.selectbox("Select a table", table_names)
if selected_table:
# Get table information
column_df, row_count, sample_df = get_table_info(selected_database, selected_schema, selected_table)
st.subheader("Table Information")
st.write(f"Table name: `{selected_database}.{selected_schema}.{selected_table}`")
st.write(f"Total rows: **{row_count:,}**")
st.subheader("Column Information")
st.dataframe(column_df)
st.subheader("Sample Data (showing only 5 rows)")
st.dataframe(sample_df)
# Stringify table information (for AI)
table_info = f"""
Table name: {selected_database}.{selected_schema}.{selected_table}
Total rows: {row_count}
Column information:
{column_df.to_string(index=False)}
Sample data:
{sample_df.to_string(index=False)}
"""
# Natural language input from user
user_query = st.text_area("Enter what you want to know about the selected table")
if st.button("Start Analysis"):
if user_query:
# Use AI to generate SQL
prompt = f"""
Based on the following table information and question, please generate an appropriate SQL query.
Return only the generated SQL query without any additional response.
Table information:
{table_info}
Question: {user_query}
Notes:
- Follow Snowflake SQL syntax.
- Use aggregate functions to keep the query result size manageable.
- Use {selected_database}.{selected_schema}.{selected_table} as the table name.
"""
generated_sql = CompleteText(lang_model, prompt)
generated_sql = clean_sql_query(generated_sql)
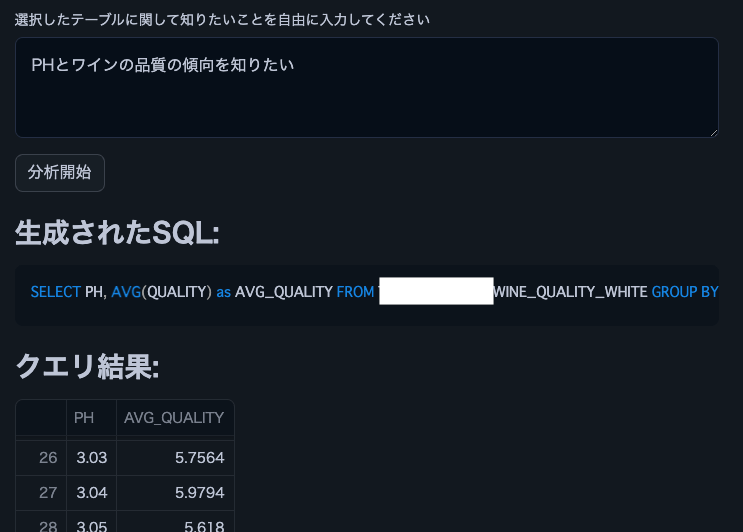
st.subheader("Generated SQL:")
st.code(generated_sql, language='sql')
try:
# Execute the generated SQL
result = session.sql(generated_sql).collect()
df = pd.DataFrame(result)
st.subheader("Query Result:")
st.dataframe(df)
# Analyze results
analyze(df, user_query)
# Smart data visualization
smart_data_visualization(df)
except Exception as e:
st.error(f"An error occurred while executing the query: {str(e)}")
else:
st.warning("Please enter a question.")
# Execution part
data_analysis_and_natural_language_query()
SQL이나 Python 지식 없이도 자연어를 사용하여 테이블 데이터를 쉽게 분석할 수 있다면 기업 사용자의 데이터 활용 범위가 크게 넓어질 수 있습니다. 여러 테이블을 조인하거나 시각화 그래프의 다양성을 늘리는 등의 기능을 추가하면 더욱 복잡한 분석을 수행할 수 있습니다. Snowflake에서 Streamlit을 사용하여 데이터 분석 민주화를 구현해 보시기 바랍니다.
Snowflake의 X에 대한 새로운 소식을 공유하고 있습니다. 관심이 있으시면 언제든지 팔로우해주세요!
Snowflake What's New Bot(영어 버전)
https://x.com/snow_new_en
Snowflake What's New Bot(일본어 버전)
https://x.com/snow_new_jp
(20240914) 첫글
https://zenn.dev/tsubasa_tech/articles/2608c820294860
위 내용은 Snowflake(SiS)의 Streamlit을 사용하여 자연어 데이터 분석을 사용해 보세요.의 상세 내용입니다. 자세한 내용은 PHP 중국어 웹사이트의 기타 관련 기사를 참조하세요!


![[웹 프런트엔드] Node.js 빠른 시작](https://img.php.cn/upload/course/000/000/067/662b5d34ba7c0227.png)


