
이 글에서는 Python을 사용하여 날씨 패턴을 분석하는 방법을 안내하겠습니다. 온도 추세 식별부터 강수량 시각화까지 이 단계별 가이드는 날씨 분석을 위한 데이터 과학 기술 사용에 관심이 있는 모든 사람에게 적합합니다. 실용적인 통찰력을 얻기 위해 코드, 데이터 조작 및 시각화를 탐구하겠습니다.
케냐에서 날씨는 다양한 분야, 특히 농업, 관광, 야외 활동에서 중요한 역할을 합니다. 농부, 기업, 이벤트 기획자는 결정을 내리기 위해 정확한 날씨 정보가 필요합니다. 그러나 날씨 패턴은 지역마다 크게 다를 수 있으며 현재 예측 시스템이 항상 현지화된 통찰력을 제공하는 것은 아닙니다.
이 프로젝트의 목적은 OpenWeatherMap API 및 Weather API에서 케냐 전역의 다양한 지역에 대한 실시간 날씨 데이터를 수집하는 것입니다. 이 데이터는 데이터베이스에 저장되고 Python을 사용하여 분석되어 다음에 대한 통찰력을 얻습니다.-
이 프로젝트에서는 케냐 여러 도시의 날씨 정보가 포함된 데이터 세트를 분석합니다. 데이터 세트에는 온도, 습도, 기압, 풍속, 가시성, 강우량 등 다양한 요인을 포함하여 3,000개 이상의 기상 관측 데이터가 포함되어 있습니다. 이러한 통찰력을 사용하여 우리는 농업, 관광, 심지어 경영과 같이 날씨에 민감한 분야의 의사 결정에 도움이 될 수 있는 정확한 지역별 일기 예보를 제공하는 것을 목표로 합니다.
데이터세트는 여러 열을 사용하여 구성되었습니다.
데이터베이스의 데이터는 이렇게 구성되어 있습니다.

분석의 첫 번째 단계에는 데이터에 대한 기본적인 탐색이 포함되었습니다.
_ 데이터 차원 - 데이터세트에는 3,000개의 행과 14개의 열이 포함되어 있습니다.
_ Null 값 - 누락된 데이터가 최소화되어 추가 분석을 위해 데이터 세트를 신뢰할 수 있습니다.
print(df1[['temperature_celsius', 'humidity_pct', 'pressure_hpa', 'wind_speed_ms', 'rain', 'clouds']].describe())
위 코드를 사용하여 숫자 열에 대한 요약 통계를 계산하여 온도, 습도, 기압, 강수량 및 구름의 범위, 평균 및 확산에 대한 통찰력을 제공했습니다.
날씨 특징을 더 명확하게 이해하기 위해 다양한 분포를 그렸습니다.
온도 분포
sns.displot(df1['temperature_celsius'], bins=50, kde=True)
plt.title('Temperature Distribution')
plt.xlabel('Temperature (Celsius)')
이 분포는 도시 전체의 일반적인 기온 분포를 나타냅니다. KDE 선 도표는 온도 확률 분포를 원활하게 추정합니다.
강우량 분포
sns.displot(df1['rain'], bins=50, kde=True)
plt.title('Rainfall Distribution')
plt.xlabel('Rainfall (mm/h)')
이 코드는 케냐 도시 전체의 강수량 분포를 분석합니다.
습도, 기압, 풍속
습도(%), 기압(hPa) 및 풍속(m/s)에 대한 유사한 분포도는 각각 다음과 같은 유용한 통찰력을 제공합니다. 데이터세트 전반에 걸쳐 이러한 매개변수의 변형이 발생합니다.
날씨 조건(예: '구름', '비')을 계산하고 원형 차트를 사용하여 시각화하여 비례 분포를 표시했습니다.
condition_counts = df1['weather_condition'].value_counts()

plt.figure(figsize=(8,8))
plt.pie(condition_counts, labels=condition_counts.index, autopct='%1.1f%%', pctdistance=1.1, labeldistance=0.6, startangle=140)
plt.title('Distribution of Weather Conditions')
plt.axis('equal')
plt.show()

One of the key analysis was the total rainfall by city:
rainfall_by_city = df1.groupby('city')['rain'].sum().sort_values()

plt.figure(figsize=(12,12))
rainfall_by_city.plot(kind='barh', color='skyblue')
plt.title('Total Rainfall by City')
plt.xlabel('Total Rainfall (mm)')
plt.ylabel('City')
plt.tight_layout()
plt.show()
This bar plot highlighted which cities received the most rain over the observed period, with a few outliers showing significant rainfall compared to others.

avg_temp_by_month.plot(kind='line')
plt.title('Average Monthly Temperature')
The line chart revealed temperature fluctuations across different months, showing seasonal changes.

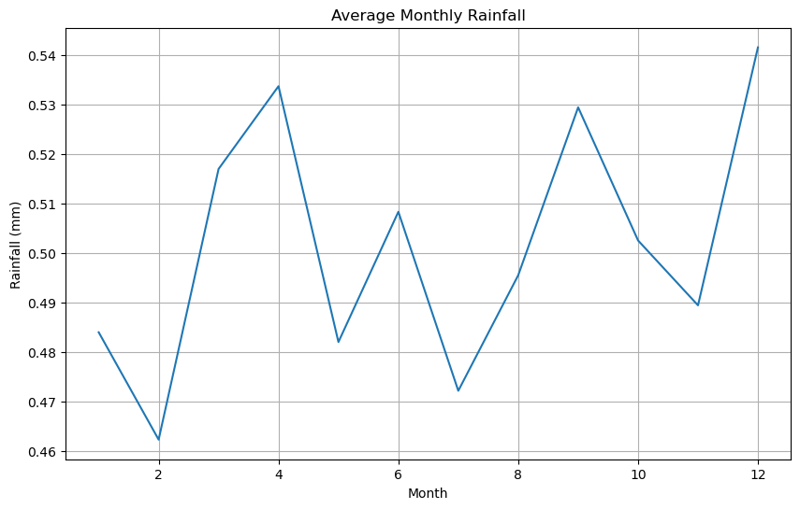
monthly_rain.plot(kind='line')
plt.title('Average Monthly Rainfall')
Similarly, rainfall was analyzed to observe how it varied month-to-month.
We also visualized the data using heatmaps for a more intuitive understanding of monthly temperature and rainfall.
Here are the heatmaps for the average monthly temperature and rainfall


Next, I calculated the correlation matrix between key weather variables:
correlation_matrix = df1[['temperature_celsius', 'humidity_pct', 'pressure_hpa', 'wind_speed_ms', 'rain', 'clouds']].corr()
correlation_matrix
sns.heatmap(correlation_matrix, annot=True, cmap='coolwarm')
plt.title('Correlation Between Weather Variables')
This heatmap allowed us to identify relationships between variables. For example, we observed a negative correlation between temperature and humidity, as expected.
I have focused on individual cities such as Mombasa and Nyeri, to explore their unique weather patterns:
Mombasa Temperature Trends
plt.plot(monthly_avg_temp_msa)
plt.title('Temperature Trends in Mombasa Over Time')
This city showed significant variation in temperature across the year.
Nyeri Rainfall Trends
plt.plot(monthly_avg_rain_nyr)
plt.title('Rainfall Trends in Nyeri Over Time')
The rainfall data for Nyeri displayed a clear seasonal pattern, with rainfall peaking during certain months.
This analysis provides a comprehensive overview of the weather conditions in major cities, highlighting the temperature, rainfall, and other key weather variables. By using visualizations like histograms, line charts, pie charts, and heatmaps, we were able to extract meaningful insights into the data. Further analysis could involve comparing these trends with historical weather patterns or exploring predictive modeling to forecast future weather trends.
You can find the Jupyter Notebook with the full code for this analysis in my GitHub repository).
위 내용은 Python을 사용한 포괄적인 기상 데이터 분석: 온도, 강수량 추세 및 시각화의 상세 내용입니다. 자세한 내용은 PHP 중국어 웹사이트의 기타 관련 기사를 참조하세요!


![[웹 프런트엔드] Node.js 빠른 시작](https://img.php.cn/upload/course/000/000/067/662b5d34ba7c0227.png)


