

Node.js 애플리케이션을 디버깅하는 방법 : 팁, 트릭 및 도구


.
- 디버깅 이해
-
디버깅은 소프트웨어 결함을 식별하고 해결하는 과정입니다. 버그를 고치는 것은 종종 간단하지만 근본 원인을 찾는 데 시간이 소요될 수 있습니다. Node.js는이 프로세스를 간소화하는 강력한 도구를 제공합니다 디버깅 용어 -
버그 방지Term Explanation Breakpoint A point in the code where the debugger pauses execution, allowing inspection of the program's state. Debugger A tool providing debugging functionalities, such as stepping through code line by line and inspecting variables. Feature (not bug) A common developer phrase used to jokingly dismiss a reported bug. Frequency How often a bug occurs under specific conditions. "It doesn't work" A vague and unhelpful bug report. Log Point An instruction to the debugger to display a variable's value at a specific point during execution. Logging Outputting runtime information to the console or a file. Logic Error The program runs without crashing, but produces incorrect results. Priority The ranking of a bug's importance in the list of planned updates. Race Condition A hard-to-trace bug caused by the unpredictable sequence or timing of events. Refactoring Rewriting code to improve readability and maintainability. Regression The re-emergence of a previously fixed bug, often due to subsequent code changes. Related Bug A bug similar to or connected to another bug. Reproduce The steps needed to trigger the error. RTFM Error User error disguised as a bug report (Read The Flipping Manual). Step Into In a debugger, execute a function call line by line. Step Out In a debugger, complete the current function's execution and return to the calling code. Step Over In a debugger, execute a command without stepping into any functions it calls. Severity The impact of a bug on the system (e.g., data loss is more severe than a minor UI issue). Stack Trace A historical list of all functions called before an error occurred. Syntax Error Errors caused by typos or incorrect code structure (e.g., console.lug()).User Error An error caused by user actions, but may still require a fix depending on the user's role. Watch A variable monitored during debugger execution. Watchpoint Similar to a breakpoint, but the program pauses only when a specific variable reaches a particular value.
코드 라이터를 사용하십시오사전 조치는 버그 발생을 크게 줄일 수 있습니다 강력한 코드 편집기 를 활용하십시오좋은 코드 편집기는 라인 번호 매기기, 자동 완성, 구문 강조 표시, 브래킷 매칭, 서식 등과 같은 기능을 제공하여 코드 품질 향상 및 오류 감소를 제공합니다. 대중적인 선택에는 대 코드, 원자 및 브래킷이 포함됩니다 Linters는 테스트하기 전에 잠재적 코드 문제 (구문 오류, 들여 쓰기 문제, 선언되지 않은 변수)를 식별합니다. eslint, jslint 및 jshint는 javaScript 및 node.js에 인기있는 옵션입니다. 명령 줄 ()에서 실행되거나 코드 편집기에 통합 될 수 있습니다. 레버리지 소스 컨트롤
소스 제어 시스템 (예 : GIT) 트랙 코드가 변경되어 버그가 언제 어디서 도입되었는지 쉽게 식별 할 수 있습니다. Github 및 Bitbucket과 같은 온라인 리포지토리는 편리한 도구와 스토리지를 제공합니다.문제 추적 시스템을 구현하십시오
문제 추적 시스템은 버그 보고서를 관리하고, 중복을 추적하고, 재생산 단계를 문서화하고, 우선 순위를 지정하고, 진행 상황을 모니터링하는 데 도움이됩니다. 많은 온라인 리포지토리에는 기본 문제 추적이 포함되지만 대규모 프로젝트에는 전용 솔루션이 더 좋습니다. 테스트 중심 개발 채택 (TDD) TDD는 코드가 이전에 를 작성하여 기능성을 확인하고 일찍 문제를 일으키는 것입니다. 휴식을 취하십시오 잠시 동안 디버깅에서 벗어나는 것은 종종 신선한 통찰력과 솔루션으로 이어질 수 있습니다. eslint myfile.jsnode.js 디버깅 : 환경 변수환경 변수 제어 node.js 응용 프로그램 설정. 는 일반적으로 디버깅 중에 로 설정됩니다. 변수는 Linux/MacOS (), Windows CMD () 또는 Windows PowerShell ()에서 설정할 수 있습니다. 또한
 모듈을 사용하여로드 할 수 있습니다.
node.js 디버깅 : 명령 줄 옵션
모듈을 사용하여로드 할 수 있습니다.
node.js 디버깅 : 명령 줄 옵션 명령 줄 옵션 Node.js 런타임 동작을 수정합니다. 출력 경고에 대한 스택 추적 (감가 상점 포함). 다른 옵션으로는 , 및 가 있습니다 콘솔 디버깅
는 기본이지만 필수 디버깅 도구입니다. 그러나 다른
, console.log(), console,.dir(),.table(),.error(), .count() 및 를 탐색하십시오. ES6 파괴 구조는 복잡한 객체 로깅을 단순화합니다 node.js.group().time().trace()조건부로 STDERR에 메시지를 씁니다. 환경 변수가 적절하게 설정된 경우에만 활성화됩니다. 이를 통해 정상 작동 중에 콘솔을 혼란스럽게하지 않고 코드로 디버그 명세서를 떠날 수 있습니다. 로그 모듈로 디버깅.clear()타사 로깅 모듈 (캐빈, 로그 레벨, 모건, 피노, 서명 등)은 로깅 레벨, 참각 제어, 파일 출력 등과 같은 고급 기능을 제공합니다. node.js V8 Inspector V8 검사관은 강력한 디버깅 도구입니다. 로 응용 프로그램을 시작하십시오. 명령에는 (Step Into), , , 및 가 포함됩니다. util.debuglognode.js chrome 로 디버깅 를 사용하려면 검사관을 시작하고 포트 9229에서 듣고 있습니다. 크롬의 를 열고 "검사"를 클릭하여 DevTools를 첨부하십시오. 중단 점을 설정하고 변수를보고 통화 스택을 검사하십시오. 원격 디버깅의 경우util.debuglogNODE_DEBUGnode.js vs code 로 디버깅을합니다파일을 사용하십시오. 다른 node.js 디버깅 도구 다른 IDES (Visual Studio, JetBrains, Webstorm), 확장 (Atom 's ), NDB, IBM Report-Toolkit 및 Logrocket 및 Sentry.io와 같은 상업 서비스를 탐색하십시오. 결론 는 유용한 상태로 유지되지만 효율적인 디버깅을위한 고급 옵션을 활용하십시오. 자주 묻는 질문 (faqs)
node inspect ./index.js- 어떤 도구를 사용할 수 있습니까? 내장 디버거, Node.js Inspector, vs Code Debugger, NDB, Node-Debug. 내장 디버거로 시작하는 방법 또는 . 시작 후
- ? 의 차이;
처음에 끊어집니다. 브레이크 포인트를 설정하는 방법? node inspect your-script.jsnode inspect-brk your-script.js문, 디버거 명령을 사용하거나 편집기 홈통 (IDES)을 클릭하십시오. 검사를 위해 콘솔에 정보를 출력하는 - 의 목적.
디버깅 비동기 코드 디버깅?
inspect를 사용하고 비동기 함수 내에서 중단 점을 설정하십시오. 성능 문제 디버깅?inspect-brk사용 , flamegraphs 및 프로파일 링 도구와 같은inspect. 원격 디버깅?inspect-brk디버거를 시작할 때 호스트 및 포트 옵션을 지정하고 지역 환경에서 연결하십시오.
 모듈을 사용하여로드 할 수 있습니다.
node.js 디버깅 : 명령 줄 옵션
모듈을 사용하여로드 할 수 있습니다.
node.js 디버깅 : 명령 줄 옵션 위 내용은 Node.js 애플리케이션을 디버깅하는 방법 : 팁, 트릭 및 도구의 상세 내용입니다. 자세한 내용은 PHP 중국어 웹사이트의 기타 관련 기사를 참조하세요!

핫 AI 도구

Undresser.AI Undress
사실적인 누드 사진을 만들기 위한 AI 기반 앱

AI Clothes Remover
사진에서 옷을 제거하는 온라인 AI 도구입니다.

Undress AI Tool
무료로 이미지를 벗다

Clothoff.io
AI 옷 제거제

Video Face Swap
완전히 무료인 AI 얼굴 교환 도구를 사용하여 모든 비디오의 얼굴을 쉽게 바꾸세요!

인기 기사
뜨거운 도구

메모장++7.3.1
사용하기 쉬운 무료 코드 편집기

SublimeText3 중국어 버전
중국어 버전, 사용하기 매우 쉽습니다.

스튜디오 13.0.1 보내기
강력한 PHP 통합 개발 환경

드림위버 CS6
시각적 웹 개발 도구

SublimeText3 Mac 버전
신 수준의 코드 편집 소프트웨어(SublimeText3)


 JavaScript 엔진 : 구현 비교
Apr 13, 2025 am 12:05 AM
JavaScript 엔진 : 구현 비교
Apr 13, 2025 am 12:05 AM
각각의 엔진의 구현 원리 및 최적화 전략이 다르기 때문에 JavaScript 엔진은 JavaScript 코드를 구문 분석하고 실행할 때 다른 영향을 미칩니다. 1. 어휘 분석 : 소스 코드를 어휘 단위로 변환합니다. 2. 문법 분석 : 추상 구문 트리를 생성합니다. 3. 최적화 및 컴파일 : JIT 컴파일러를 통해 기계 코드를 생성합니다. 4. 실행 : 기계 코드를 실행하십시오. V8 엔진은 즉각적인 컴파일 및 숨겨진 클래스를 통해 최적화하여 Spidermonkey는 유형 추론 시스템을 사용하여 동일한 코드에서 성능이 다른 성능을 제공합니다.
 Python vs. JavaScript : 학습 곡선 및 사용 편의성
Apr 16, 2025 am 12:12 AM
Python vs. JavaScript : 학습 곡선 및 사용 편의성
Apr 16, 2025 am 12:12 AM
Python은 부드러운 학습 곡선과 간결한 구문으로 초보자에게 더 적합합니다. JavaScript는 가파른 학습 곡선과 유연한 구문으로 프론트 엔드 개발에 적합합니다. 1. Python Syntax는 직관적이며 데이터 과학 및 백엔드 개발에 적합합니다. 2. JavaScript는 유연하며 프론트 엔드 및 서버 측 프로그래밍에서 널리 사용됩니다.
 JavaScript : 웹 언어의 다양성 탐색
Apr 11, 2025 am 12:01 AM
JavaScript : 웹 언어의 다양성 탐색
Apr 11, 2025 am 12:01 AM
JavaScript는 현대 웹 개발의 핵심 언어이며 다양성과 유연성에 널리 사용됩니다. 1) 프론트 엔드 개발 : DOM 운영 및 최신 프레임 워크 (예 : React, Vue.js, Angular)를 통해 동적 웹 페이지 및 단일 페이지 응용 프로그램을 구축합니다. 2) 서버 측 개발 : Node.js는 비 차단 I/O 모델을 사용하여 높은 동시성 및 실시간 응용 프로그램을 처리합니다. 3) 모바일 및 데스크탑 애플리케이션 개발 : 크로스 플랫폼 개발은 개발 효율을 향상시키기 위해 반응 및 전자를 통해 실현됩니다.
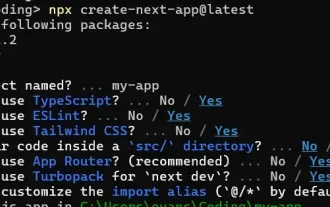 Next.js (Frontend Integration)를 사용하여 멀티 테넌트 SaaS 응용 프로그램을 구축하는 방법
Apr 11, 2025 am 08:22 AM
Next.js (Frontend Integration)를 사용하여 멀티 테넌트 SaaS 응용 프로그램을 구축하는 방법
Apr 11, 2025 am 08:22 AM
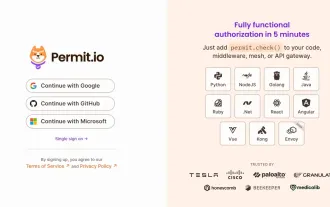
이 기사에서는 Contrim에 의해 확보 된 백엔드와의 프론트 엔드 통합을 보여 주며 Next.js를 사용하여 기능적인 Edtech SaaS 응용 프로그램을 구축합니다. Frontend는 UI 가시성을 제어하기 위해 사용자 권한을 가져오고 API가 역할 기반을 준수하도록합니다.
 Next.js (백엔드 통합)로 멀티 테넌트 SAAS 애플리케이션 구축
Apr 11, 2025 am 08:23 AM
Next.js (백엔드 통합)로 멀티 테넌트 SAAS 애플리케이션 구축
Apr 11, 2025 am 08:23 AM
일상적인 기술 도구를 사용하여 기능적 다중 테넌트 SaaS 응용 프로그램 (Edtech 앱)을 구축했으며 동일한 작업을 수행 할 수 있습니다. 먼저, 다중 테넌트 SaaS 응용 프로그램은 무엇입니까? 멀티 테넌트 SAAS 응용 프로그램은 노래에서 여러 고객에게 서비스를 제공 할 수 있습니다.
 C/C에서 JavaScript까지 : 모든 것이 어떻게 작동하는지
Apr 14, 2025 am 12:05 AM
C/C에서 JavaScript까지 : 모든 것이 어떻게 작동하는지
Apr 14, 2025 am 12:05 AM
C/C에서 JavaScript로 전환하려면 동적 타이핑, 쓰레기 수집 및 비동기 프로그래밍으로 적응해야합니다. 1) C/C는 수동 메모리 관리가 필요한 정적으로 입력 한 언어이며 JavaScript는 동적으로 입력하고 쓰레기 수집이 자동으로 처리됩니다. 2) C/C를 기계 코드로 컴파일 해야하는 반면 JavaScript는 해석 된 언어입니다. 3) JavaScript는 폐쇄, 프로토 타입 체인 및 약속과 같은 개념을 소개하여 유연성과 비동기 프로그래밍 기능을 향상시킵니다.
 JavaScript 및 웹 : 핵심 기능 및 사용 사례
Apr 18, 2025 am 12:19 AM
JavaScript 및 웹 : 핵심 기능 및 사용 사례
Apr 18, 2025 am 12:19 AM
웹 개발에서 JavaScript의 주요 용도에는 클라이언트 상호 작용, 양식 검증 및 비동기 통신이 포함됩니다. 1) DOM 운영을 통한 동적 컨텐츠 업데이트 및 사용자 상호 작용; 2) 사용자가 사용자 경험을 향상시키기 위해 데이터를 제출하기 전에 클라이언트 확인이 수행됩니다. 3) 서버와의 진실한 통신은 Ajax 기술을 통해 달성됩니다.
 자바 스크립트 행동 : 실제 예제 및 프로젝트
Apr 19, 2025 am 12:13 AM
자바 스크립트 행동 : 실제 예제 및 프로젝트
Apr 19, 2025 am 12:13 AM
실제 세계에서 JavaScript의 응용 프로그램에는 프론트 엔드 및 백엔드 개발이 포함됩니다. 1) DOM 운영 및 이벤트 처리와 관련된 TODO 목록 응용 프로그램을 구축하여 프론트 엔드 애플리케이션을 표시합니다. 2) Node.js를 통해 RESTFULAPI를 구축하고 Express를 통해 백엔드 응용 프로그램을 시연하십시오.
