

Stellar (xlm)는 주요 표시기가'구매'로 튀어 나오면서 낙관적으로 변합니다. 다음 목표는 다음과 같습니다.

Ali, a crypto analyst, shared an important update about Stellar (XLM). According to Ali, “Stellar $XLM could be gearing up for a bounce

Crypto analyst Ali has shared an important update about Stellar (XLM). According to Ali, “Stellar $XLM could be gearing up for a bounce, as the TD Sequential indicator flashes a buy signal on the hourly chart. One to watch closely!”
Stellar Set For Bounce Vs Tether As TD Counts Provide Key Buy Signal
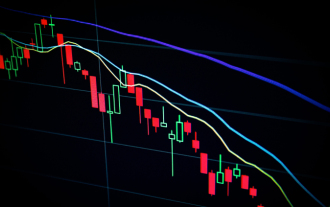
The hourly candlestick chart for Stellar against Tether is showing some interesting developments. At the time of writing, XLM was trading at approximately $0.27818, showing a 1.13% increase from the previous candle.
One technical indicator that stands out is the TD Sequential indicator, which has displayed a red 9 on the chart. This indicator is known for highlighting potential trend exhaustion and reversal points.
Typically, when we see a 9-count like this, it often suggests that a downward trend may be losing momentum, and we could see a bounce or reversal soon.
Chart: TradingView
Considering the candlestick patterns, the recent trend has been clearly bearish with an ongoing series of black candles. However, the most recent activity shows signs of a potential reversal. We can see a large black candle, likely representing a final push downward, followed by a white bullish candle that suggests buyers are stepping in.
For traders focusing on support and resistance levels, the recent low point around $0.2739 could serve as an immediate area of interest on the lower side. On the upper side, the next resistance levels to watch are closely at $0.2800 and above that, around $0.2830-0.2850 based on previous price action.
Daily Chart Provides Broader Context
Zooming out to examine the daily chart, we can see XLM is in an even more interesting position. There’s a clear descending trendline connecting lower highs since the November 2024 top, when XLM reached around $0.63. This trendline has acted as resistance multiple times.
At the same time, there’s a strong horizontal support zone between approximately $0.26 and $0.275, which has been tested several times since January. Currently, the price is attempting to form a base, trading just above this support area at around $0.277.
This situation shows that XLM is consolidating within a tightening range. It’s being pressured from above by the descending trendline while being supported from below by the horizontal demand zone. In case the price turns strongly bullish, the major price target would be the descending trendline.
Read Also: Can Ripple Really Overtake Ethereum? Analyst Shares Insight On XRP Path To $100
However, traders should be aware that a breakdown below $0.26 would invalidate this support and could lead to a bearish scenario. If the price fails to bounce and breaks down from the support zone, we might see a sharp drop, possibly toward $0.24 or lower, which is the next untested support from November 2024.
Follow us on X (Twitter), CoinMarketCap and Binance Square for more daily crypto updates.Get all our future calls by joining our FREE Telegram group.
We recommend eToro
위 내용은 Stellar (xlm)는 주요 표시기가'구매'로 튀어 나오면서 낙관적으로 변합니다. 다음 목표는 다음과 같습니다.의 상세 내용입니다. 자세한 내용은 PHP 중국어 웹사이트의 기타 관련 기사를 참조하세요!

핫 AI 도구

Undresser.AI Undress
사실적인 누드 사진을 만들기 위한 AI 기반 앱

AI Clothes Remover
사진에서 옷을 제거하는 온라인 AI 도구입니다.

Undress AI Tool
무료로 이미지를 벗다

Clothoff.io
AI 옷 제거제

Video Face Swap
완전히 무료인 AI 얼굴 교환 도구를 사용하여 모든 비디오의 얼굴을 쉽게 바꾸세요!

인기 기사
뜨거운 도구

메모장++7.3.1
사용하기 쉬운 무료 코드 편집기

SublimeText3 중국어 버전
중국어 버전, 사용하기 매우 쉽습니다.

스튜디오 13.0.1 보내기
강력한 PHP 통합 개발 환경

드림위버 CS6
시각적 웹 개발 도구

SublimeText3 Mac 버전
신 수준의 코드 편집 소프트웨어(SublimeText3)
뜨거운 주제
 7788
7788
 15
1644
14
1401
52
1298
25
1234
29
15
1644
14
1401
52
1298
25
1234
29

 Pi Network (PI) Price Falls 성공적인 Pifest 2025 이벤트
Apr 03, 2025 am 10:08 AM
Pi Network (PI) Price Falls 성공적인 Pifest 2025 이벤트
Apr 03, 2025 am 10:08 AM
PI Network는 최근 토큰의 채택을 늘리는 행사 인 Pifest 2025를 개최했습니다. 125,000 명 이상의 판매자와 58,000 명의 판매자가 참여했습니다
 OKX OUYI Exchange 웹 버전 입력 링크를 클릭하십시오.
Mar 31, 2025 pm 06:21 PM
OKX OUYI Exchange 웹 버전 입력 링크를 클릭하십시오.
Mar 31, 2025 pm 06:21 PM
1. OKX EUYI Exchange의 웹 버전을 입력하십시오. 2. OKX EUYI Exchange 앱의 링크를 클릭하십시오. 사용자는 기존 계정에 로그인하거나 자신의 상황에 따라 새 계정을 등록하도록 선택할 수 있습니다. 실시간 시장 조건을 보거나 거래 수행 또는 자산 관리에 관계없이 OKX 웹 버전은 초보자와 재향 군인에게 적합한 간단하고 원활한 운영 경험을 제공합니다. 쉬운 경험을 보려면 지금 OKX 공식 웹 사이트를 방문하십시오
 Ruvi AI (Ruvi) 토큰 사전 판매는 폭발적인 발사 후 20 배가 될 수 있습니다.
Apr 03, 2025 am 11:08 AM
Ruvi AI (Ruvi) 토큰 사전 판매는 폭발적인 발사 후 20 배가 될 수 있습니다.
Apr 03, 2025 am 11:08 AM
Crypto Market은 Cardano (ADA)가 12%에서 0.64 달러로 떨어지면서 Altcoin 부문의 우려를 불러 일으키면서 계속 난기류에 직면하고 있습니다.
 진짜 Ouyi를 어디에서 다운로드할까요? 공식 웹 사이트 다운로드. 글로벌
Mar 31, 2025 pm 02:09 PM
진짜 Ouyi를 어디에서 다운로드할까요? 공식 웹 사이트 다운로드. 글로벌
Mar 31, 2025 pm 02:09 PM
Ouyi는 일반적으로 Ouyi Okx를 말합니다. OUYI OKX 앱을 다운로드하는 전역의 방법은 다음과 같습니다. 1. Android 장치 : 공식 웹 사이트를 통해 APK 파일을 다운로드하여 설치하십시오. 2. iOS 장치 : 브라우저를 통해 공식 웹 사이트에 액세스하고 앱을 직접 다운로드하십시오.
 Ouyi는 무엇입니까? Ouyi는 무엇입니까?
Apr 01, 2025 pm 03:18 PM
Ouyi는 무엇입니까? Ouyi는 무엇입니까?
Apr 01, 2025 pm 03:18 PM
OKX는 글로벌 디지털 자산 거래 플랫폼입니다. 주요 기능에는 1. 디지털 자산 구매 및 판매 (SPOT 거래), 2. 디지털 자산 간의 거래, 3. 시장 조건 및 데이터 제공, 4. 파생 상품과 같은 다양한 거래 제품 제공, 5. 자산 부가가치 서비스 제공, 6. 편리한 자산 관리.
 Blockdag는 $ 200m 인 Beta Testnet을 출시하고 Ethereum은 $ 2,000에 접근하고 Tether가 미디어로 확장됩니다.
Apr 03, 2025 am 10:34 AM
Blockdag는 $ 200m 인 Beta Testnet을 출시하고 Ethereum은 $ 2,000에 접근하고 Tether가 미디어로 확장됩니다.
Apr 03, 2025 am 10:34 AM
이더 리움 (ETH) 가격 가장자리에 저항에 대한 가격 가장자리, Tether News는 € 10m 미디어 거래를 보여 주었고 Blockdag는 베타 테스트 넷과 채택이 증가함에 따라 새로운 이정표에 도달합니다.
 Gate.io 등록 자습서
Mar 31, 2025 pm 11:09 PM
Gate.io 등록 자습서
Mar 31, 2025 pm 11:09 PM
이 기사는 공식 웹 사이트에 액세스하는 것부터 등록 정보 작성, 등록 정보 작성, 확인, 사용자 계약 읽기 등의 모든 단계를 다루는 자세한 Gate.io 등록 자습서를 제공합니다.이 기사는 또한 2 차 검증을 설정하고 실제 인증을 설정하고 초보자의 디지털 자산 거래를 시작하는 등의 성공적인 등록을 성공적으로 등록한 후 보안 조치를 강조합니다.
 초보자를위한 Gate.io 최신 등록 자습서
Mar 31, 2025 pm 11:12 PM
초보자를위한 Gate.io 최신 등록 자습서
Mar 31, 2025 pm 11:12 PM
이 기사는 초보자에게 자세한 GATE.IO 등록 자습서를 제공하여 공식 웹 사이트 액세스, 정보 작성, 신원 확인 등을 포함하여 등록 프로세스를 점차적으로 완료하도록 안내하고 등록 후 보안 설정을 강조합니다. 또한이 기사는 Binance, Ouyi 및 참깨 오픈 도어와 같은 다른 교환을 언급했습니다. 초보자는 자신의 요구에 따라 올바른 플랫폼을 선택하고 독자들에게 디지털 자산 투자가 위험하고 합리적으로 투자해야한다는 것을 상기시키는 것이 좋습니다.