

Excel Groupby는 그룹 행 및 집계 값에 대한 기능입니다

Unlock the Power of Excel's GROUPBY Function for Enhanced Data Analysis! This function simplifies data grouping, summarization, sorting, and filtering, all within a single formula. Say goodbye to complex outlines, subtotals, and pivot tables – GROUPBY streamlines your workflow.
Excel's data analysis capabilities just got a significant boost. While features like outlines and pivot tables have long been staples for organizing and interpreting data, the new GROUPBY function offers a more streamlined approach, all within the convenience of your formula bar.
- Understanding the Excel GROUPBY Function: Syntax and Basic Applications
- GROUPBY Function Availability and Compatibility
- Constructing a Basic GROUPBY Formula
- Mastering GROUPBY: Advanced Formula Examples
- Selecting the Right Aggregation Function
- Displaying Headers Effectively
- Grouping Rows Using Multiple Columns
- Grouping with Non-Adjacent Columns
- Controlling the Display of Totals and Subtotals
- Sorting Grouped Data
- Filtering Results
- Aggregating Multiple Columns (Adjacent and Non-Adjacent)
- Multiple Aggregations on a Single Dataset
- Handling Comma-Separated Text Strings
- Auto-Formatting GROUPBY Results with Conditional Formatting
- Troubleshooting GROUPBY Function Issues
The Excel GROUPBY Function
The GROUPBY function efficiently groups and aggregates data rows based on values in one or more columns. It also supports sorting and filtering of grouped data. As a dynamic array function, it returns multiple results, spilling into adjacent cells. The output resembles a pivot table without the formatting; the spill range dynamically recalculates with data changes. This is particularly beneficial for large datasets requiring summarized data through functions like SUM, AVERAGE, or COUNT.

Note: GROUPBY is similar to PIVOTBY, but GROUPBY exclusively groups data in rows.
Function Syntax
GROUPBY(row_fields, values, function, [field_headers], [total_depth], [sort_order], [filter_array])
Seven arguments are available, but only the first three are mandatory:
-
row_fields(required): The range of values to group by. -
values(required): The values to aggregate. -
function(required): The aggregation function (e.g.,SUM,AVERAGE,COUNT,MIN,MAX). -
field_headers(optional): Controls header display (0: No headers, 1: Yes, but don't show, 2: No headers, but generate, 3: Yes, and show). -
total_depth(optional): Controls total/subtotal display (0: No totals, 1: Grand total at bottom, 2: Grand and subtotals at bottom, -1: Grand total at top, -2: Grand and subtotals at top). -
sort_order(optional): Sorts by column index (positive for ascending, negative for descending). Arrays allow multi-column sorting. -
filter_array(optional): Filters rows using a Boolean array.
Usage Tips
- Dynamic Updates: The formula dynamically adjusts to dataset changes within its range. Adding new rows requires including them in the argument ranges or using an Excel table for automatic expansion.
-
Header Detection: If
field_headersis omitted, Excel infers headers based on thevaluesargument (text followed by a number suggests headers). -
Range Consistency:
row_fieldsandvaluesmust have equal lengths to avoid#VALUE!errors. - Conditional Formatting: Enhance readability by using conditional formatting to highlight totals and subtotals.
Note: GROUPBY is under development; thorough testing is recommended.
GROUPBY Function Availability
Currently available in Excel for Microsoft 365 (Insider Beta Channel).
Basic GROUPBY Formula
Let's assume a dataset with project names (Column A), types (Column B), and revenues (Column C). To summarize revenues by project type:
=GROUPBY(B2:B32, C2:C32, SUM)
This yields a list of unique project types with their revenue sums. Defaults are used for optional arguments (no headers, ascending sort, grand total at bottom).

Advanced GROUPBY Formula Examples
This section expands on the basic example, demonstrating the function's versatility.
Choosing the Aggregation Function
GROUPBY supports 16 aggregation functions, including standard functions (SUM, AVERAGE, COUNT, etc.) and specialized ones (PERCENTOF, ARRAYTOTEXT). These are eta-reduced lambdas, simplifying usage. Custom lambda functions are also supported. Multiple aggregations are possible using vectors (vertical for column stacking, horizontal for row stacking).
Displaying Headers
Use the field_headers argument (set to 3) to include headers in the output.
=GROUPBY(B2:B32, C2:C32, SUM, 3)

Grouping by Multiple Columns
Include a multi-column range in row_fields to group by multiple columns. For example, grouping by project type and status:
=GROUPBY(B2:C32, D2:D32, COUNT)

Grouping by Non-Adjacent Columns
Use CHOOSECOLS to select non-adjacent columns for grouping:
=GROUPBY(CHOOSECOLS(A2:D32, 2, 4), C2:C32, COUNT)

Controlling Totals and Subtotals
Use total_depth to control total/subtotal display. Setting it to 2 shows both grand and subtotals.
=GROUPBY(B2:C32, D2:D32, SUM, 3, 2)

Sorting Grouped Rows
Use sort_order for custom sorting (positive for ascending, negative for descending). Arrays enable multi-column sorting.
=GROUPBY(B2:B32, C2:C32, SUM, , , 2) (Sorts by values)

=GROUPBY(B2:C32, D2:D32, SUM, , , {-1,2}) (Multi-column sort)

Filtering Results
Use filter_array (Boolean array) to filter rows.
=GROUPBY(B2:B32, C2:C32, SUM, , , , B2:B32<>"Design")

Aggregating Multiple Columns
Aggregate adjacent columns directly:
=GROUPBY(B2:B32, D2:E32, AVERAGE, 3)

For non-adjacent columns, use CHOOSECOLS:
=GROUPBY(B2:B32, CHOOSECOLS(C2:E32, 1, 3), AVERAGE, 3)

Multiple Aggregations on the Same Data
Use HSTACK or VSTACK for multiple aggregations:
=GROUPBY(B3:B32, C3:C32, HSTACK(SUM, AVERAGE, PERCENTOF))
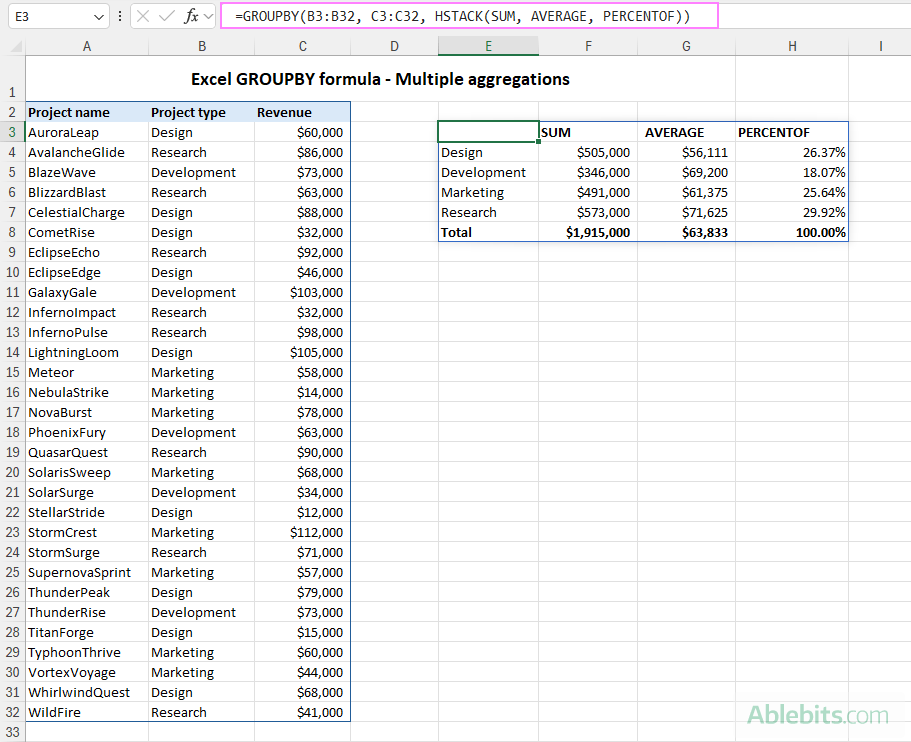
=GROUPBY(B3:B32, C3:C32, VSTACK(SUM, AVERAGE, MIN, MAX),, 0)

Grouping Comma-Separated Text Values
Use ARRAYTOTEXT to group comma-separated text:
=GROUPBY(B3:B23, A3:A23, ARRAYTOTEXT, 0, 0)

Conditional Formatting of GROUPBY Results
Enhance visual clarity using conditional formatting to highlight headers, totals, and subtotals.
Troubleshooting GROUPBY Function Issues
- Function Unavailability: Ensure you have a Microsoft 365 subscription and the latest updates.
-
#VALUE!Error: Check for equal lengths inrow_fieldsandvaluesarguments, and ensure correctfilter_arraylength. Also, verify thattotal_depthis appropriate for the number of columns inrow_fields. -
#SPILL!Error: Clear adjacent cells to allow spill range.
In conclusion, the GROUPBY function significantly enhances Excel's data analysis capabilities, providing a powerful and efficient tool for various data manipulation tasks. With practice, you'll unlock its full potential for insightful data analysis.
위 내용은 Excel Groupby는 그룹 행 및 집계 값에 대한 기능입니다의 상세 내용입니다. 자세한 내용은 PHP 중국어 웹사이트의 기타 관련 기사를 참조하세요!

핫 AI 도구

Undresser.AI Undress
사실적인 누드 사진을 만들기 위한 AI 기반 앱

AI Clothes Remover
사진에서 옷을 제거하는 온라인 AI 도구입니다.

Undress AI Tool
무료로 이미지를 벗다

Clothoff.io
AI 옷 제거제

Video Face Swap
완전히 무료인 AI 얼굴 교환 도구를 사용하여 모든 비디오의 얼굴을 쉽게 바꾸세요!
인기 기사
뜨거운 도구

메모장++7.3.1
사용하기 쉬운 무료 코드 편집기

SublimeText3 중국어 버전
중국어 버전, 사용하기 매우 쉽습니다.

스튜디오 13.0.1 보내기
강력한 PHP 통합 개발 환경

드림위버 CS6
시각적 웹 개발 도구

SublimeText3 Mac 버전
신 수준의 코드 편집 소프트웨어(SublimeText3)


 Excel의 중간 공식 - 실제 예
Apr 11, 2025 pm 12:08 PM
Excel의 중간 공식 - 실제 예
Apr 11, 2025 pm 12:08 PM
이 튜토리얼은 중간 기능을 사용하여 Excel에서 수치 데이터의 중앙값을 계산하는 방법을 설명합니다. 중앙 경향의 주요 척도 인 중앙값은 데이터 세트의 중간 값을 식별하여 Central Tenden의보다 강력한 표현을 제공합니다.
 Excel 공유 통합 문서 : 여러 사용자를위한 Excel 파일을 공유하는 방법
Apr 11, 2025 am 11:58 AM
Excel 공유 통합 문서 : 여러 사용자를위한 Excel 파일을 공유하는 방법
Apr 11, 2025 am 11:58 AM
이 튜토리얼은 다양한 방법, 액세스 제어 및 갈등 해결을 다루는 Excel 통합 문서 공유에 대한 포괄적 인 안내서를 제공합니다. Modern Excel 버전 (2010, 2013, 2016 및 이후) 협업 편집을 단순화하여 M에 대한 필요성을 제거합니다.
 Google 스프레드 시트 Countif 기능은 공식 예제와 함께합니다
Apr 11, 2025 pm 12:03 PM
Google 스프레드 시트 Countif 기능은 공식 예제와 함께합니다
Apr 11, 2025 pm 12:03 PM
마스터 Google Sheets Countif : 포괄적 인 가이드 이 안내서는 Google 시트의 다목적 카운티프 기능을 탐색하여 간단한 셀 카운팅 이외의 응용 프로그램을 보여줍니다. 우리는 정확하고 부분적인 경기에서 Han에 이르기까지 다양한 시나리오를 다룰 것입니다.
 Excel을 JPG로 변환하는 방법 - 이미지 파일로 .xls 또는 .xlsx를 저장
Apr 11, 2025 am 11:31 AM
Excel을 JPG로 변환하는 방법 - 이미지 파일로 .xls 또는 .xlsx를 저장
Apr 11, 2025 am 11:31 AM
이 자습서는 .xls 파일을 .jpg 이미지로 변환하는 다양한 방법을 탐색하여 내장 된 Windows 도구와 무료 온라인 변환기를 모두 포함합니다. 프레젠테이션을 만들거나 스프레드 시트 데이터를 단단히 공유하거나 문서를 디자인해야합니까? YO를 변환합니다
 Google Sheets 차트 자습서 : Google 시트에서 차트를 만드는 방법
Apr 11, 2025 am 09:06 AM
Google Sheets 차트 자습서 : Google 시트에서 차트를 만드는 방법
Apr 11, 2025 am 09:06 AM
이 자습서는 Google 시트에서 다양한 차트를 작성하여 다양한 데이터 시나리오에 적합한 차트 유형을 선택하는 방법을 보여줍니다. 또한 3D 및 Gantt 차트를 만드는 방법과 차트를 편집, 복사 및 삭제하는 방법을 배웁니다. 데이터 시각화는 CRU입니다
 Excel 열 및 행에서 데이터를 뒤집는 방법 (수직 및 수평)
Apr 11, 2025 am 09:05 AM
Excel 열 및 행에서 데이터를 뒤집는 방법 (수직 및 수평)
Apr 11, 2025 am 09:05 AM
이 튜토리얼은 Excel에서 수직 및 수평으로 테이블을 뒤집는 몇 가지 효율적인 방법을 보여줍니다. Excel에는 직접적인 "플립"기능이 부족하지만 여러 해결 방법이 있습니다. 뒤집는 DAT
 Excel Dynamic 이름이 지정된 범위 : 생성 및 사용 방법
Apr 11, 2025 am 10:19 AM
Excel Dynamic 이름이 지정된 범위 : 생성 및 사용 방법
Apr 11, 2025 am 10:19 AM
이 튜토리얼은 데이터가 변경 될 때 계산을 자동으로 업데이트하는 Dynamic이라는 Ranges를 생성하고 사용하는 방법을 보여줍니다. 정적 이름이 지정된 범위와 달리 동적 범위는 수동 개입없이 새로운 데이터를 포함하도록 조정됩니다. 지난주 혀
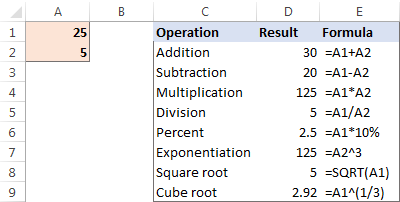 Excel에서 계산을 수행하는 방법
Apr 11, 2025 am 10:20 AM
Excel에서 계산을 수행하는 방법
Apr 11, 2025 am 10:20 AM
이 튜토리얼은 Microsoft Excel 내에서 산술 계산을 수행하고 공식의 작업 순서를 수정하는 방법을 보여줍니다. Excel의 기능은 간단한 추가를 넘어 확장됩니다. H 덕분에 복잡한 계산을 처리 할 수 있습니다
