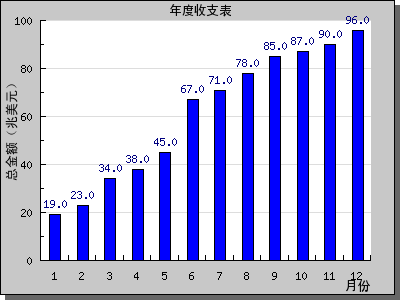
php_php에서 Jpgraph를 사용하여 세로 막대형 차트를 그리는 방법 팁
이 기사의 예제에서는 Jpgraph를 사용하여 PHP에서 세로 막대형 차트를 그리는 방법을 설명합니다. 참고할 수 있도록 모든 사람과 공유하세요. 구체적인 구현 방법은 다음과 같습니다.
<?php
include ("src/jpgraph.php");
include ("src/jpgraph_bar.php");
$data = array(19,23,34,38,45,67,71,78,85,87,90,96); //定义数组
$graph = new Graph(400,300); //创建新的Graph对象
$graph->SetScale("textlin");
$graph->SetShadow(); //设置阴影
$graph->img->SetMargin(40,30,20,40); //设置边距
$barplot = new BarPlot($data); //创建BarPlot对象
$barplot->SetFillColor('blue'); //设置颜色
$barplot->value->Show(); //设置显示数字
$graph->Add($barplot); //将柱形图添加到图像中
$graph->title->Set("年度收支表"); //设置标题和X-Y轴标题
$graph->xaxis->title->Set("月份");
$graph->yaxis->title->Set("总金额(兆美元)");
$graph->title->SetFont(FF_SIMSUN,FS_BOLD); //设置字体
$graph->yaxis->title->SetFont(FF_SIMSUN,FS_BOLD);
$graph->xaxis->title->SetFont(FF_SIMSUN,FS_BOLD);
$graph->Stroke();
?>작동 효과는 아래와 같습니다.

이 기사가 모든 사람의 PHP 프로그래밍 설계에 도움이 되기를 바랍니다.

핫 AI 도구

Undresser.AI Undress
사실적인 누드 사진을 만들기 위한 AI 기반 앱

AI Clothes Remover
사진에서 옷을 제거하는 온라인 AI 도구입니다.

Undress AI Tool
무료로 이미지를 벗다

Clothoff.io
AI 옷 제거제

AI Hentai Generator
AI Hentai를 무료로 생성하십시오.

인기 기사

뜨거운 도구

메모장++7.3.1
사용하기 쉬운 무료 코드 편집기

SublimeText3 중국어 버전
중국어 버전, 사용하기 매우 쉽습니다.

스튜디오 13.0.1 보내기
강력한 PHP 통합 개발 환경

드림위버 CS6
시각적 웹 개발 도구

SublimeText3 Mac 버전
신 수준의 코드 편집 소프트웨어(SublimeText3)

뜨거운 주제
 7393
7393
 15
15
 1630
1630
 14
14
 1358
1358
 52
52
 1268
1268
 25
25
 1217
1217
 29
29
 CakePHP 프로젝트 구성
Sep 10, 2024 pm 05:25 PM
이번 장에서는 CakePHP의 환경 변수, 일반 구성, 데이터베이스 구성, 이메일 구성에 대해 알아봅니다.
 Ubuntu 및 Debian용 PHP 8.4 설치 및 업그레이드 가이드
Dec 24, 2024 pm 04:42 PM
PHP 8.4는 상당한 양의 기능 중단 및 제거를 통해 몇 가지 새로운 기능, 보안 개선 및 성능 개선을 제공합니다. 이 가이드에서는 Ubuntu, Debian 또는 해당 파생 제품에서 PHP 8.4를 설치하거나 PHP 8.4로 업그레이드하는 방법을 설명합니다.
 CakePHP 토론
Sep 10, 2024 pm 05:28 PM
CakePHP는 PHP용 오픈 소스 프레임워크입니다. 이는 애플리케이션을 훨씬 쉽게 개발, 배포 및 유지 관리할 수 있도록 하기 위한 것입니다. CakePHP는 강력하고 이해하기 쉬운 MVC와 유사한 아키텍처를 기반으로 합니다. 모델, 뷰 및 컨트롤러 gu
 CakePHP 데이터베이스 작업
Sep 10, 2024 pm 05:25 PM
CakePHP에서 데이터베이스 작업은 매우 쉽습니다. 이번 장에서는 CRUD(생성, 읽기, 업데이트, 삭제) 작업을 이해하겠습니다.


