matplotlib 도면을 이용한 Python의 자세한 설명
Matplotlib는 Python의 가장 유명한 그리기 라이브러리로 matlab과 유사한 명령 API 세트를 제공하며 이는 대화형 그리기에 매우 적합합니다. 또한 그리기 컨트롤로 쉽게 사용하고 GUI 애플리케이션에 내장할 수도 있습니다. 문서는 매우 완벽하며 갤러리 페이지에는 수백 개의 썸네일이 있으며 모두 열면 소스 프로그램이 있습니다. 따라서 특정 유형의 다이어그램을 그려야 하는 경우 이 페이지에서 찾아보기/복사/붙여넣기만 하면 기본적으로 완료됩니다.
이 기사에서는 matplotlib를 사용하여 가장 간단한 막대를 복잡한 막대까지 단계별로 구성합니다. 가장 간단한 바는 무엇인가요? 다음 문장을 읽어보면 얼마나 간단한지 알 수 있습니다.
import matplotlib.pyplot as plt

plt.bar(left = 0,height = 1)
plt.show()
실행 효과:
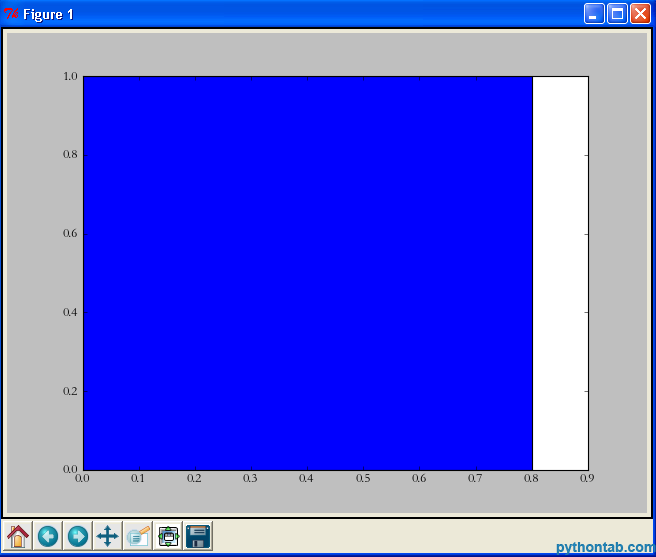
네, 셋 그냥요. 한 문장, 내가 본 것 중 가장 간단한 그림 문장. 먼저 matplotlib.pyplot을 가져온 다음 bar 메서드를 직접 호출하고 마지막으로 show를 사용하여 이미지를 표시했습니다. bar의 두 매개변수에 대해 설명하겠습니다.
left: 열의 왼쪽 가장자리 위치입니다. 1을 지정하면 현재 열의 왼쪽 가장자리의 x 값은 1.0입니다.
height : 컬럼의 높이로, Y축 left의 값으로, 별도의 값(컬럼임)을 사용하는 것 외에 height를 다음과 같이 대체할 수도 있습니다. 튜플(여러 직사각형을 나타냄) 예를 들어 다음 예에서는import matplotlib.pyplot as plt plt.bar(left = (0,1),height = (1,0.5)) plt.show()
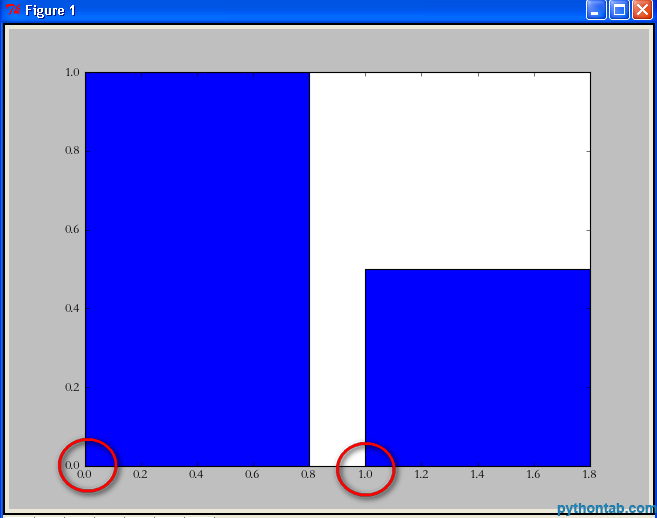
import matplotlib.pyplot as plt

plt.bar(left = (0,1),height = (1,0.5),width = 0.35)
plt.show()
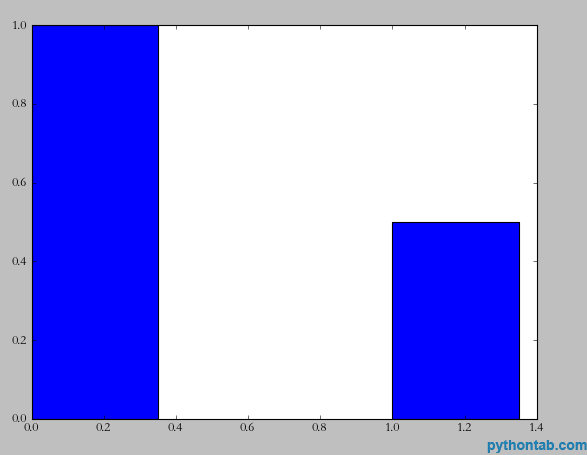
import matplotlib.pyplot as plt

plt.xlabel(u'性别')
plt.ylabel(u'人数')
plt.bar(left = (0,1),height = (1,0.5),width = 0.35)
plt.show()
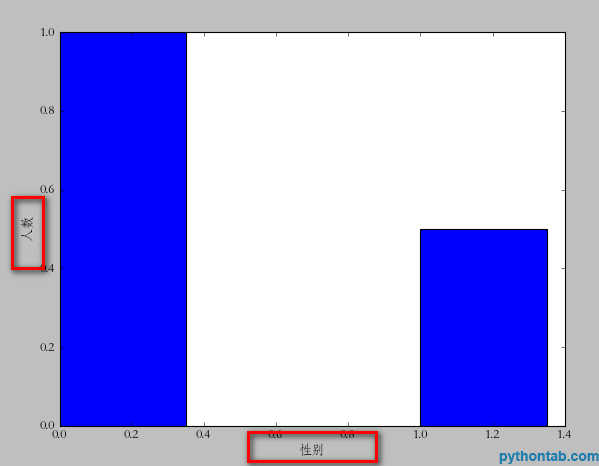
import matplotlib.pyplot as plt

plt.xlabel(u'性别')
plt.ylabel(u'人数')

plt.xticks((0,1),(u'男',u'女'))

plt.bar(left = (0,1),height = (1,0.5),width = 0.35)

plt.show()
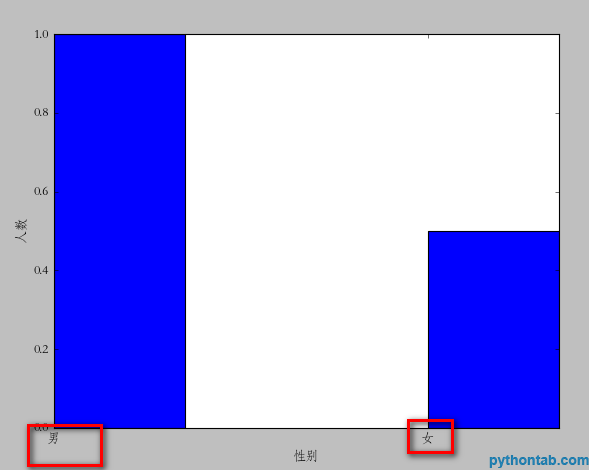
import matplotlib.pyplot as plt

plt.xlabel(u'性别')
plt.ylabel(u'人数')

plt.xticks((0,1),(u'男',u'女'))

plt.bar(left = (0,1),height = (1,0.5),width = 0.35,align="center")

plt.show()
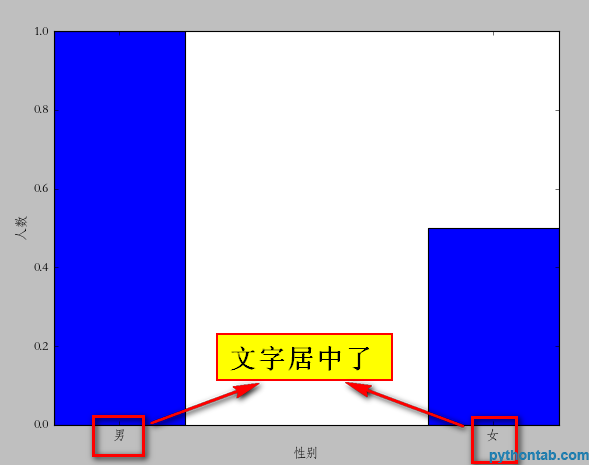
plt.title(u"性别比例分析")
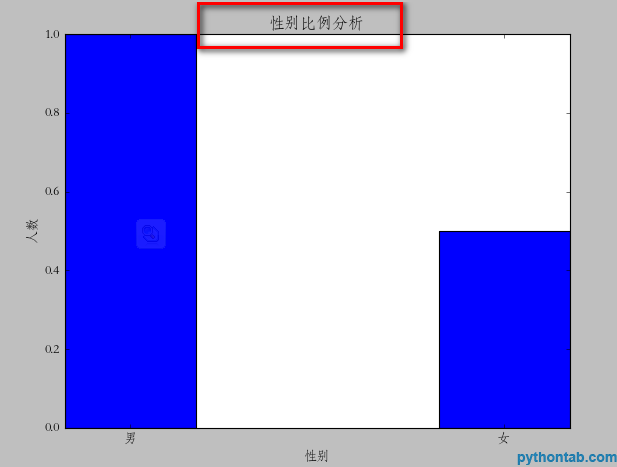
import matplotlib.pyplot as plt

plt.xlabel(u'性别')
plt.ylabel(u'人数')


plt.title(u"性别比例分析")
plt.xticks((0,1),(u'男',u'女'))
rect = plt.bar(left = (0,1),height = (1,0.5),width = 0.35,align="center")

plt.legend((rect,),(u"图例",))

plt.show()
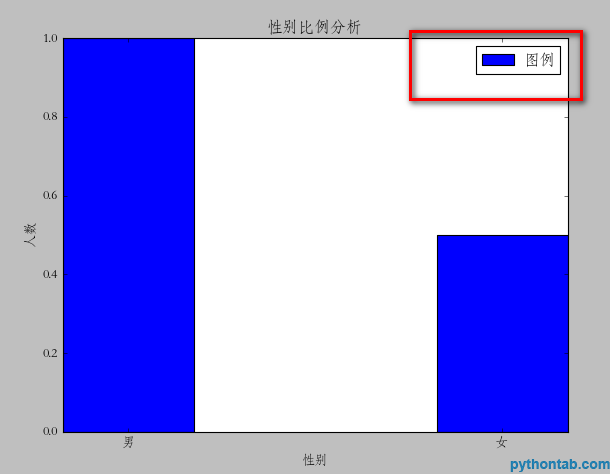
def autolabel(rects):
    for rect in rects:
        height = rect.get_height()
plt.text(rect.get_x()+rect.get_width()/2., 1.03*height, '%s' % float(height))import matplotlib.pyplot as plt
def autolabel(rects):
for rect in rects:
height = rect.get_height()
plt.text(rect.get_x()+rect.get_width()/2., 1.03*height, '%s' % float(height))
plt.xlabel(u'性别')
plt.ylabel(u'人数')
plt.title(u"性别比例分析")
plt.xticks((0,1),(u'男',u'女'))
rect = plt.bar(left = (0,1),height = (1,0.5),width = 0.35,align="center")
plt.legend((rect,),(u"图例",))
autolabel(rect)
plt.show()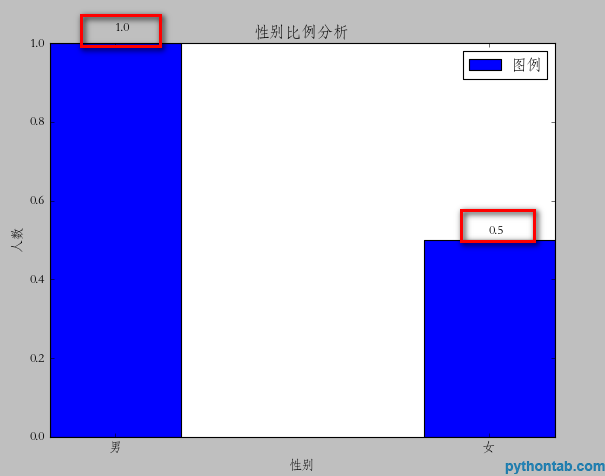
direct = plt.bar(left = (0,1),height = (1,0.5),width = 0.35,align="center",yerr=0.000001 )
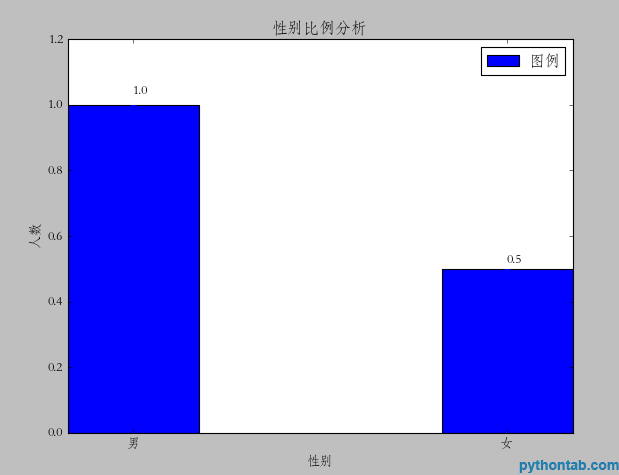

핫 AI 도구

Undresser.AI Undress
사실적인 누드 사진을 만들기 위한 AI 기반 앱

AI Clothes Remover
사진에서 옷을 제거하는 온라인 AI 도구입니다.

Undress AI Tool
무료로 이미지를 벗다

Clothoff.io
AI 옷 제거제

AI Hentai Generator
AI Hentai를 무료로 생성하십시오.

인기 기사

뜨거운 도구

메모장++7.3.1
사용하기 쉬운 무료 코드 편집기

SublimeText3 중국어 버전
중국어 버전, 사용하기 매우 쉽습니다.

스튜디오 13.0.1 보내기
강력한 PHP 통합 개발 환경

드림위버 CS6
시각적 웹 개발 도구

SublimeText3 Mac 버전
신 수준의 코드 편집 소프트웨어(SublimeText3)

뜨거운 주제
 7464
7464
 15
15
 1376
1376
 52
52
 77
77
 11
11
 45
45
 19
19
 18
18
 19
19
 설치 후 MySQL을 사용하는 방법
Apr 08, 2025 am 11:48 AM
이 기사는 MySQL 데이터베이스의 작동을 소개합니다. 먼저 MySQLworkBench 또는 명령 줄 클라이언트와 같은 MySQL 클라이언트를 설치해야합니다. 1. MySQL-Uroot-P 명령을 사용하여 서버에 연결하고 루트 계정 암호로 로그인하십시오. 2. CreateABase를 사용하여 데이터베이스를 작성하고 데이터베이스를 선택하십시오. 3. CreateTable을 사용하여 테이블을 만들고 필드 및 데이터 유형을 정의하십시오. 4. InsertInto를 사용하여 데이터를 삽입하고 데이터를 쿼리하고 업데이트를 통해 데이터를 업데이트하고 DELETE를 통해 데이터를 삭제하십시오. 이러한 단계를 마스터하고 일반적인 문제를 처리하는 법을 배우고 데이터베이스 성능을 최적화하면 MySQL을 효율적으로 사용할 수 있습니다.
 PS 페더 링은 어떻게 전환의 부드러움을 제어합니까?
Apr 06, 2025 pm 07:33 PM
깃털 통제의 열쇠는 점진적인 성격을 이해하는 것입니다. PS 자체는 그라디언트 곡선을 직접 제어하는 옵션을 제공하지 않지만 여러 깃털, 일치하는 마스크 및 미세 선택으로 반경 및 구배 소프트를 유연하게 조정하여 자연스럽게 전이 효과를 달성 할 수 있습니다.
 MySQL은 지불해야합니다
Apr 08, 2025 pm 05:36 PM
MySQL에는 무료 커뮤니티 버전과 유료 엔터프라이즈 버전이 있습니다. 커뮤니티 버전은 무료로 사용 및 수정할 수 있지만 지원은 제한되어 있으며 안정성이 낮은 응용 프로그램에 적합하며 기술 기능이 강합니다. Enterprise Edition은 안정적이고 신뢰할 수있는 고성능 데이터베이스가 필요하고 지원 비용을 기꺼이 지불하는 응용 프로그램에 대한 포괄적 인 상업적 지원을 제공합니다. 버전을 선택할 때 고려 된 요소에는 응용 프로그램 중요도, 예산 책정 및 기술 기술이 포함됩니다. 완벽한 옵션은없고 가장 적합한 옵션 만 있으므로 특정 상황에 따라 신중하게 선택해야합니다.
 PS 페더 링을 설정하는 방법?
Apr 06, 2025 pm 07:36 PM
PS 페더 링은 이미지 가장자리 블러 효과로, 가장자리 영역에서 픽셀의 가중 평균에 의해 달성됩니다. 깃털 반경을 설정하면 흐림 정도를 제어 할 수 있으며 값이 클수록 흐려집니다. 반경을 유연하게 조정하면 이미지와 요구에 따라 효과를 최적화 할 수 있습니다. 예를 들어, 캐릭터 사진을 처리 할 때 더 작은 반경을 사용하여 세부 사항을 유지하고 더 큰 반경을 사용하여 예술을 처리 할 때 흐릿한 느낌을줍니다. 그러나 반경이 너무 커서 가장자리 세부 사항을 쉽게 잃을 수 있으며 너무 작아 효과는 분명하지 않습니다. 깃털 효과는 이미지 해상도의 영향을받으며 이미지 이해 및 효과 파악에 따라 조정해야합니다.
 MySQL 설치 후 데이터베이스 성능을 최적화하는 방법
Apr 08, 2025 am 11:36 AM
MySQL 성능 최적화는 설치 구성, 인덱싱 및 쿼리 최적화, 모니터링 및 튜닝의 세 가지 측면에서 시작해야합니다. 1. 설치 후 innodb_buffer_pool_size 매개 변수와 같은 서버 구성에 따라 my.cnf 파일을 조정해야합니다. 2. 과도한 인덱스를 피하기 위해 적절한 색인을 작성하고 Execution 명령을 사용하여 실행 계획을 분석하는 것과 같은 쿼리 문을 최적화합니다. 3. MySQL의 자체 모니터링 도구 (showprocesslist, showstatus)를 사용하여 데이터베이스 건강을 모니터링하고 정기적으로 백업 및 데이터베이스를 구성하십시오. 이러한 단계를 지속적으로 최적화함으로써 MySQL 데이터베이스의 성능을 향상시킬 수 있습니다.
 PS 깃털은 이미지 품질에 어떤 영향을 미칩니 까?
Apr 06, 2025 pm 07:21 PM
PS 페더 링은 이미지 세부 사항 손실, 색상 포화 감소 및 노이즈 증가로 이어질 수 있습니다. 충격을 줄이려면 더 작은 깃털 반경을 사용하고 레이어를 복사 한 다음 깃털을 복사 한 다음 깃털 전후에 이미지 품질을 조심스럽게 비교하는 것이 좋습니다. 또한 깃털이 모든 경우에 적합하지는 않으며 때로는 마스크와 같은 도구가 이미지 가장자리를 처리하는 데 더 적합합니다.
 고로드 애플리케이션의 MySQL 성능을 최적화하는 방법은 무엇입니까?
Apr 08, 2025 pm 06:03 PM
MySQL 데이터베이스 성능 최적화 안내서 리소스 집약적 응용 프로그램에서 MySQL 데이터베이스는 중요한 역할을 수행하며 대규모 트랜잭션 관리를 담당합니다. 그러나 응용 프로그램 규모가 확장됨에 따라 데이터베이스 성능 병목 현상은 종종 제약이됩니다. 이 기사는 일련의 효과적인 MySQL 성능 최적화 전략을 탐색하여 응용 프로그램이 고 부하에서 효율적이고 반응이 유지되도록합니다. 실제 사례를 결합하여 인덱싱, 쿼리 최적화, 데이터베이스 설계 및 캐싱과 같은 심층적 인 주요 기술을 설명합니다. 1. 데이터베이스 아키텍처 설계 및 최적화 된 데이터베이스 아키텍처는 MySQL 성능 최적화의 초석입니다. 몇 가지 핵심 원칙은 다음과 같습니다. 올바른 데이터 유형을 선택하고 요구 사항을 충족하는 가장 작은 데이터 유형을 선택하면 저장 공간을 절약 할 수있을뿐만 아니라 데이터 처리 속도를 향상시킬 수 있습니다.
 MongoDB 데이터베이스 비밀번호를 보는 Navicat의 방법
Apr 08, 2025 pm 09:39 PM
해시 값으로 저장되기 때문에 MongoDB 비밀번호를 Navicat을 통해 직접 보는 것은 불가능합니다. 분실 된 비밀번호 검색 방법 : 1. 비밀번호 재설정; 2. 구성 파일 확인 (해시 값이 포함될 수 있음); 3. 코드를 점검하십시오 (암호 하드 코드 메일).


