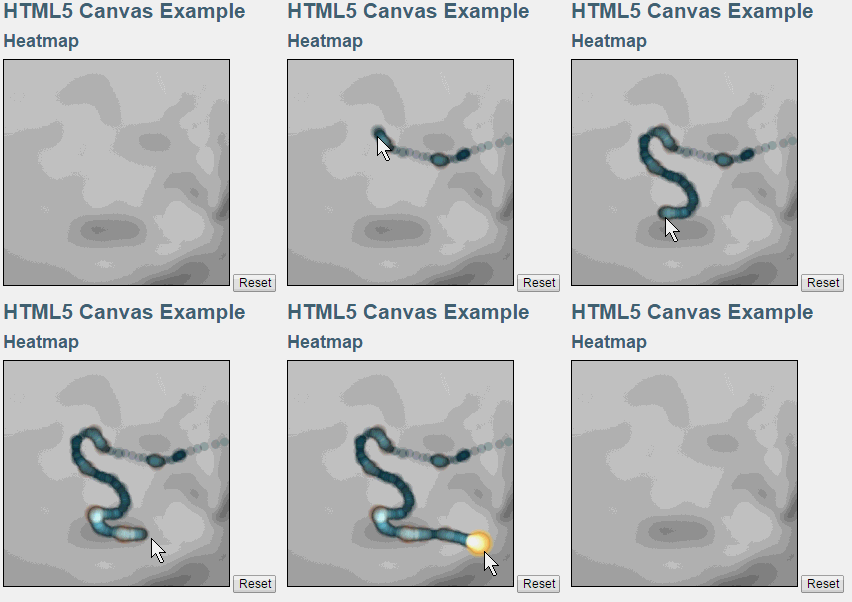
캔버스 API를 사용하면 그래픽, 차트, 그림 편집 등 다양한 애플리케이션을 만들 수 있습니다. 가장 멋진 애플리케이션 중 하나는 기존 콘텐츠를 수정하거나 덮어쓰는 것입니다. 가장 널리 사용되는 오버레이 맵은 히트 맵이라고 합니다. 히트 맵은 도시 지도에서 교통 상황을 표시하거나 폭풍 활동을 표시하는 데 사용할 수 있습니다.
지도에서는 캔버스를 지도 위에 쌓기만 하면 표시됩니다. 실제로 캔버스를 사용하여 지도를 덮은 다음 해당 활동 데이터를 기반으로 다양한 열 수준을 그립니다.
아래 예시가 나와 있습니다.
<!DOCTYPE html>
<html>
<title>HTML5 Canvas Example</title>
<style type="text/css">
@import url("styles.css");
#heatmap {
background-image: url("mapbg.jpg");
}
</style>
<h1>HTML5 Canvas Example</h1>
<h2>Heatmap </h2>
<canvas id="heatmap" class="clear" style="border: 1px solid ; " height="300" width="300"> </canvas>
<button id="resetButton">Reset</button>
<script>
function log() {
console.log(arguments);
}
var points = {};
var SCALE = 3;
var x = -1;
var y = -1;
function loadDemo() {
document.getElementById("resetButton").onclick = reset;
canvas = document.getElementById("heatmap");
context = canvas.getContext('2d');
context.globalAlpha = 0.2;
context.globalCompositeOperation = "lighter";
function sample() {
if (x != -1) {
addToPoint(x,y)
}
setTimeout(sample, 100);
}
canvas.onmousemove = function(e) {
x = e.clientX - e.target.offsetLeft;
y = e.clientY - e.target.offsetTop;
addToPoint(x,y)
}
sample();
}
function reset() {
points = {};
context.clearRect(0,0,300,300);
x = -1;
y = -1;
}
function getColor(intensity) {
var colors = ["#072933", "#2E4045", "#8C593B", "#B2814E", "#FAC268", "#FAD237"];
return colors[Math.floor(intensity/2)];
}
function drawPoint(x, y, radius) {
context.fillStyle= getColor(radius);
radius = Math.sqrt(radius)*6;
context.beginPath();
context.arc(x, y, radius, 0, Math.PI*2, true)
context.closePath();
context.fill();
}
function addToPoint(x, y) {
x = Math.floor(x/SCALE);
y= Math.floor(y/SCALE);
if (!points[[x,y]]) {
points[[x,y]] = 1;
} else if (points[[x,y]]==10) {
return
} else {
points[[x,y]]++;
}
drawPoint(x*SCALE,y*SCALE, points[[x,y]]);
}
window.addEventListener("load", loadDemo, true);
</script>
</html>
위 내용은 HTML5 10의 내용입니다. __Canvas API를 사용하여 "히트맵"을 생성하는 방법은 다음과 같습니다. PHP 중국어 웹사이트(www.php.cn)를 주목하세요!