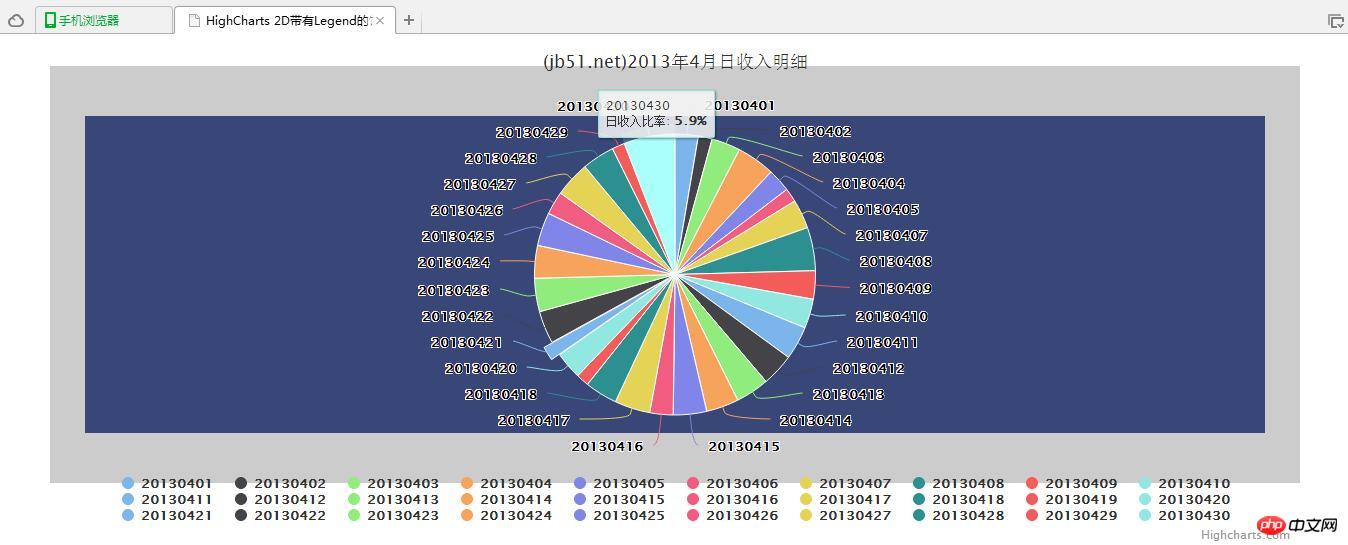
이 글에서는 Legend로 2차원 원형 차트를 그리는 jQuery 플러그인 HighCharts를 주로 소개하며, HighCharts를 사용하여 jQuery의 구현 기술을 분석하여 예제 형태로 상세하게 표시되는 원형 차트도 함께 제공합니다. 독자들이 참조용으로 다운로드할 수 있는 코드입니다. 친구들이 참조할 수 있으므로 모두에게 도움이 되기를 바랍니다.
이 기사의 예에서는 Legend를 사용하여 2D 원형 차트 효과를 그리는 jQuery 플러그인 HighCharts를 설명합니다. 다음과 같이 참조용으로 모든 사람과 공유하세요.
<!DOCTYPE html>
<html>
<head>
<meta charset="UTF-8">
<title>HighCharts 2D带有Legend的饼图</title>
<script type="text/javascript" src="js/jquery-1.7.2.min.js"></script>
<script type="text/javascript" src="js/highcharts.js"></script>
<script type="text/javascript">
$(function(){
// 构建饼图
$('#pieChart').highcharts({
chart: {
plotBackgroundColor: '#384778',
plotBorderWidth: '50px',
plotShadow: true
},
title: {
text: '(jb51.net)2013年4月日收入明细'
},
tooltip: {
pointFormat: '{series.name}: <b>{point.percentage:.1f}%</b>'
},
plotOptions: {
pie: {
allowPointSelect: true,
cursor: 'pointer',
dataLabels: {
enabled: true
},
showInLegend: true
}
},
series: [{
type: 'pie',
name: '日收入比率',
data: [
['20130401', 45.0],
['20130402', 26.8],
['20130403', 56.3],
['20130404', 74.1],
['20130405', 45.0],
['20130406', 26.8],
['20130407', 56.4],
['20130408', 84.1],
['20130409', 55.0],
['20130410', 56.8],
['20130411', 64.8],
['20130412', 63.2],
['20130413', 64.8],
['20130414', 63.2],
['20130415', 64.8],
['20130416', 45.2],
['20130417', 68.8],
['20130418', 63.2],
['20130419', 24.8],
['20130420', 53.2],
{
name: '20130421',
y: 27.8,
sliced: true,
selected: true
},
['20130422', 63.2],
['20130423', 64.8],
['20130424', 63.2],
['20130425', 64.8],
['20130426', 45.2],
['20130427', 68.8],
['20130428', 63.2],
['20130429', 24.8],
['20130430', 98.8]
]
}]
});
});
</script>
</head>
<body>
<p id="pieChart" style="width: 1250px; height: 500px; margin: 0 auto"></p>
</body>
</html> jQuery 플러그인 HighCharts 드로잉 2D 원형 차트 효과 예
위 내용은 HighCharts는 Legend와 공유하는 2D 원형 차트 효과 예시를 그립니다.의 상세 내용입니다. 자세한 내용은 PHP 중국어 웹사이트의 기타 관련 기사를 참조하세요!