이 글에서는 주로 jQuery 플러그인 echarts를 사용하여 꺾은선형 차트의 다중선 및 선점 색상을 설정하는 방법을 소개하고, 예시 형식으로 꺾은선형 차트를 설정하기 위한 jQuery 플러그인 echarts의 관련 운영 기술을 분석합니다. . 필요하신 분들은 참고하시면 도움이 될 것 같습니다.
1. 문제 배경
선형 차트를 디자인했지만 그래픽이 플러그인에 포함된 색상을 사용하지 않습니다. 선과 꼭지점의 색상을 사용자 정의해야 합니다.
2. code
(1) 그래픽 자체 할당 색상
<!DOCTYPE html>
<html>
<head>
<meta charset="UTF-8">
<title>echarts-设置折线图中折线线条颜色和折线点颜色</title>
<link rel="shortcut icon" href="../js/echarts-2.2.7/doc/asset/ico/favicon.png" rel="external nofollow" rel="external nofollow" rel="external nofollow" >
<script type="text/javascript" src="../js/echarts-2.2.7/doc/asset/js/jquery.min.js" ></script>
<script type="text/javascript" src="../js/echarts-2.2.7/doc/example/www2/js/echarts-all.js" ></script>
<style>
body,html{
width: 99%;
height: 99%;
font-family: "微软雅黑";
font-size: 12px;
}
#line{
width: 100%;
height: 100%;
}
</style>
<script>
$(function(){
var chart = document.getElementById('line');
var echart = echarts.init(chart);
var option = {
title: {
text: ''
},
tooltip: {
trigger: 'axis'
},
legend: {
data:['销售量']
},
grid: {
left: '3%',
right: '4%',
bottom: '3%',
containLabel: true
},
toolbox: {
feature: {
saveAsImage: {}
}
},
xAxis: {
type: 'category',
boundaryGap: false,
data: ['周一','周二','周三','周四','周五','周六','周日']
},
yAxis: {
type: 'value'
},
series: [
{
name:'销售量',
type:'line',
stack: '销售量',
data:[220, 132, 601, 314, 890, 230, 510]
}
]
};
echart.setOption(option);
});
</script>
</head>
<body>
<p id="line"></p>
</body>
</html>(2) 선 사용자 정의 색상
<!DOCTYPE html>
<html>
<head>
<meta charset="UTF-8">
<title>echarts-设置折线图中折线线条颜色和折线点颜色</title>
<link rel="shortcut icon" href="../js/echarts-2.2.7/doc/asset/ico/favicon.png" rel="external nofollow" rel="external nofollow" rel="external nofollow" >
<script type="text/javascript" src="../js/echarts-2.2.7/doc/asset/js/jquery.min.js" ></script>
<script type="text/javascript" src="../js/echarts-2.2.7/doc/example/www2/js/echarts-all.js" ></script>
<style>
body,html{
width: 99%;
height: 99%;
font-family: "微软雅黑";
font-size: 12px;
}
#line{
width: 100%;
height: 100%;
}
</style>
<script>
$(function(){
var chart = document.getElementById('line');
var echart = echarts.init(chart);
var option = {
title: {
text: ''
},
tooltip: {
trigger: 'axis'
},
legend: {
data:['销售量']
},
grid: {
left: '3%',
right: '4%',
bottom: '3%',
containLabel: true
},
toolbox: {
feature: {
saveAsImage: {}
}
},
xAxis: {
type: 'category',
boundaryGap: false,
data: ['周一','周二','周三','周四','周五','周六','周日']
},
yAxis: {
type: 'value'
},
series: [
{
name:'销售量',
type:'line',
stack: '销售量',
itemStyle : {
normal : {
lineStyle:{
 color:'#00FF00'
}
}
},
data:[220, 132, 601, 314, 890, 230, 510]
}
]
};
echart.setOption(option);
});
</script>
</head>
<body>
<p id="line"></p>
</body>
</html>(3) Vertex 사용자 정의 색상
<!DOCTYPE html>
<html>
<head>
<meta charset="UTF-8">
<title>echarts-设置折线图中折线线条颜色和折线点颜色</title>
<link rel="shortcut icon" href="../js/echarts-2.2.7/doc/asset/ico/favicon.png" rel="external nofollow" rel="external nofollow" rel="external nofollow" >
<script type="text/javascript" src="../js/echarts-2.2.7/doc/asset/js/jquery.min.js" ></script>
<script type="text/javascript" src="../js/echarts-2.2.7/doc/example/www2/js/echarts-all.js" ></script>
<style>
body,html{
width: 99%;
height: 99%;
font-family: "微软雅黑";
font-size: 12px;
}
#line{
width: 100%;
height: 100%;
}
</style>
<script>
$(function(){
var chart = document.getElementById('line');
var echart = echarts.init(chart);
var option = {
title: {
text: ''
},
tooltip: {
trigger: 'axis'
},
legend: {
data:['销售量']
},
grid: {
left: '3%',
right: '4%',
bottom: '3%',
containLabel: true
},
toolbox: {
feature: {
saveAsImage: {}
}
},
xAxis: {
type: 'category',
boundaryGap: false,
data: ['周一','周二','周三','周四','周五','周六','周日']
},
yAxis: {
type: 'value'
},
series: [
{
name:'销售量',
type:'line',
stack: '销售量',
itemStyle : {
normal : {
color:'#00FF00',
lineStyle:{
color:'#00FF00'
}
}
},
data:[220, 132, 601, 314, 890, 230, 510]
}
]
};
echart.setOption(option);
});
</script>
</head>
<body>
<p id="line"></p>
</body>
</html>3. 구현 결과
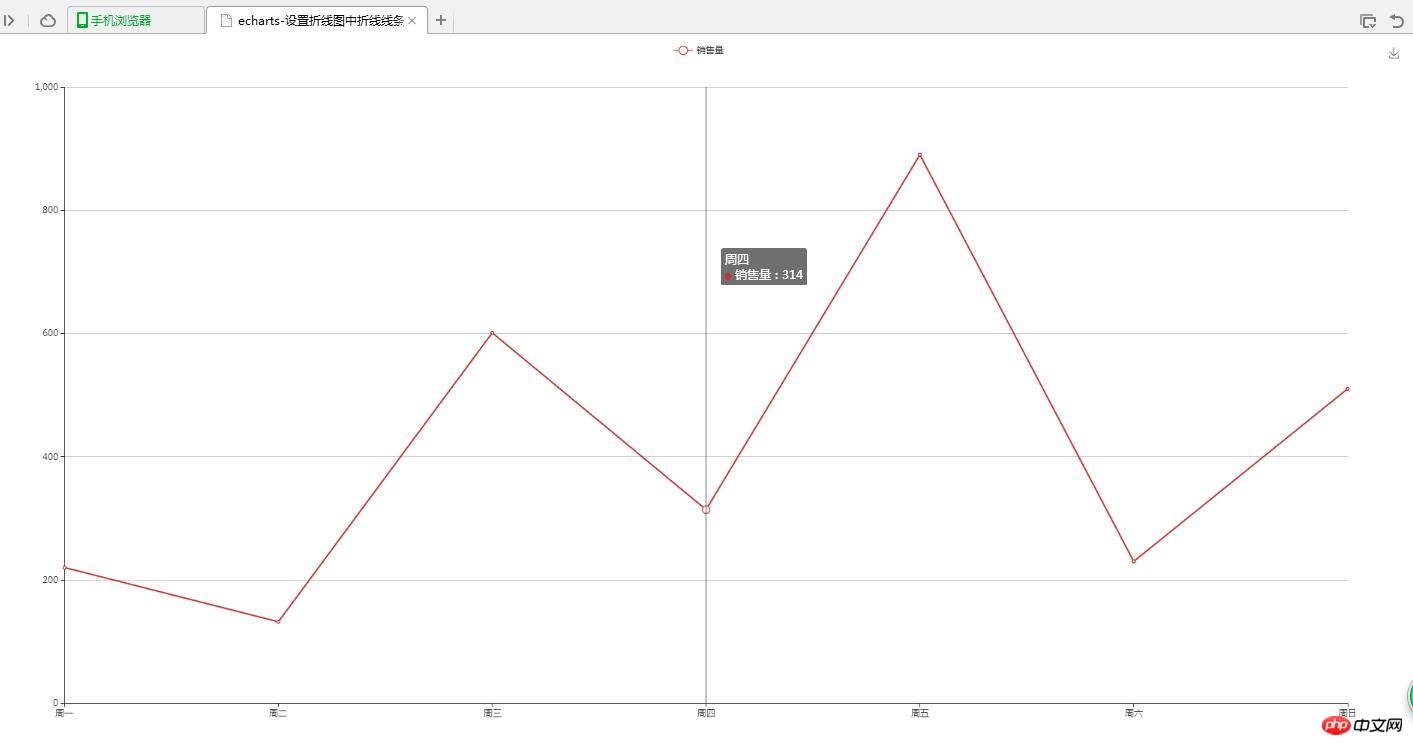
(1) 그래픽 자체 할당 색상

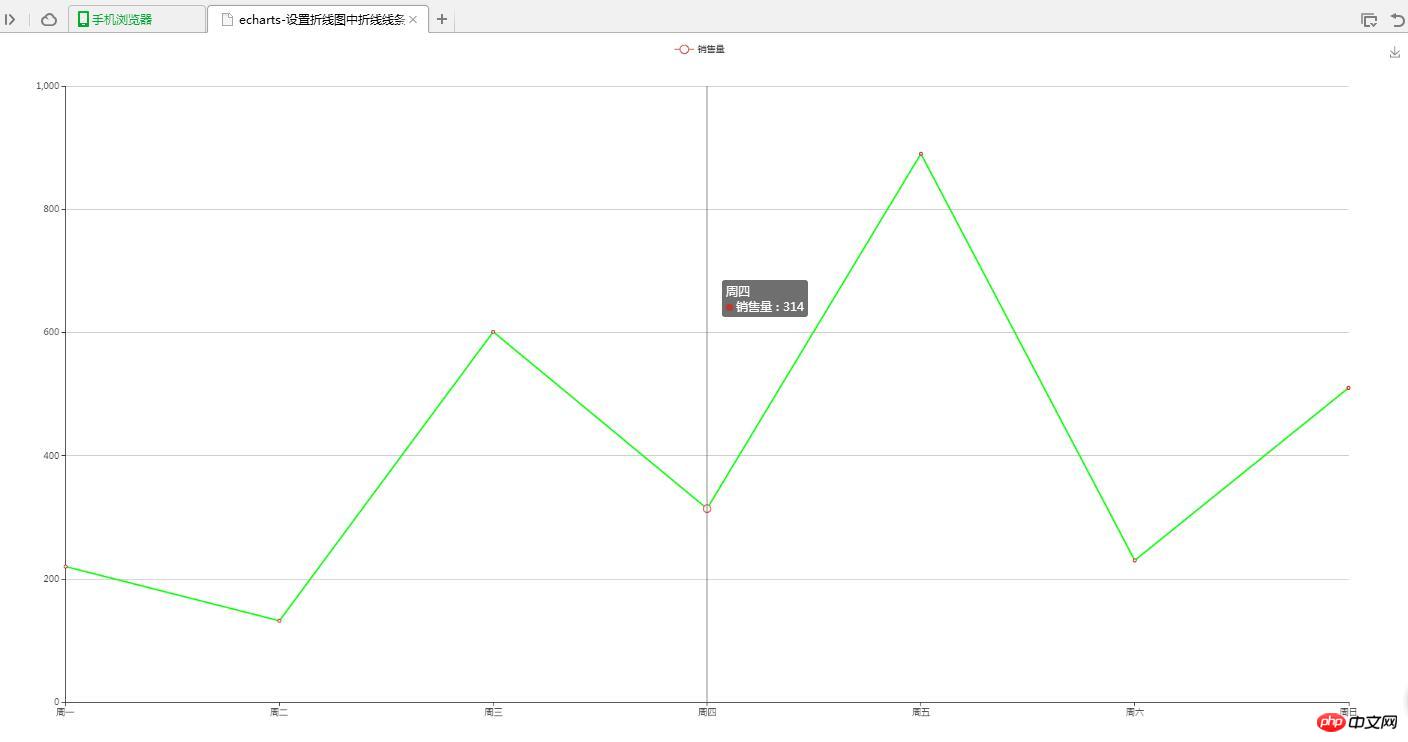
(2) 선 자체 정의 색상

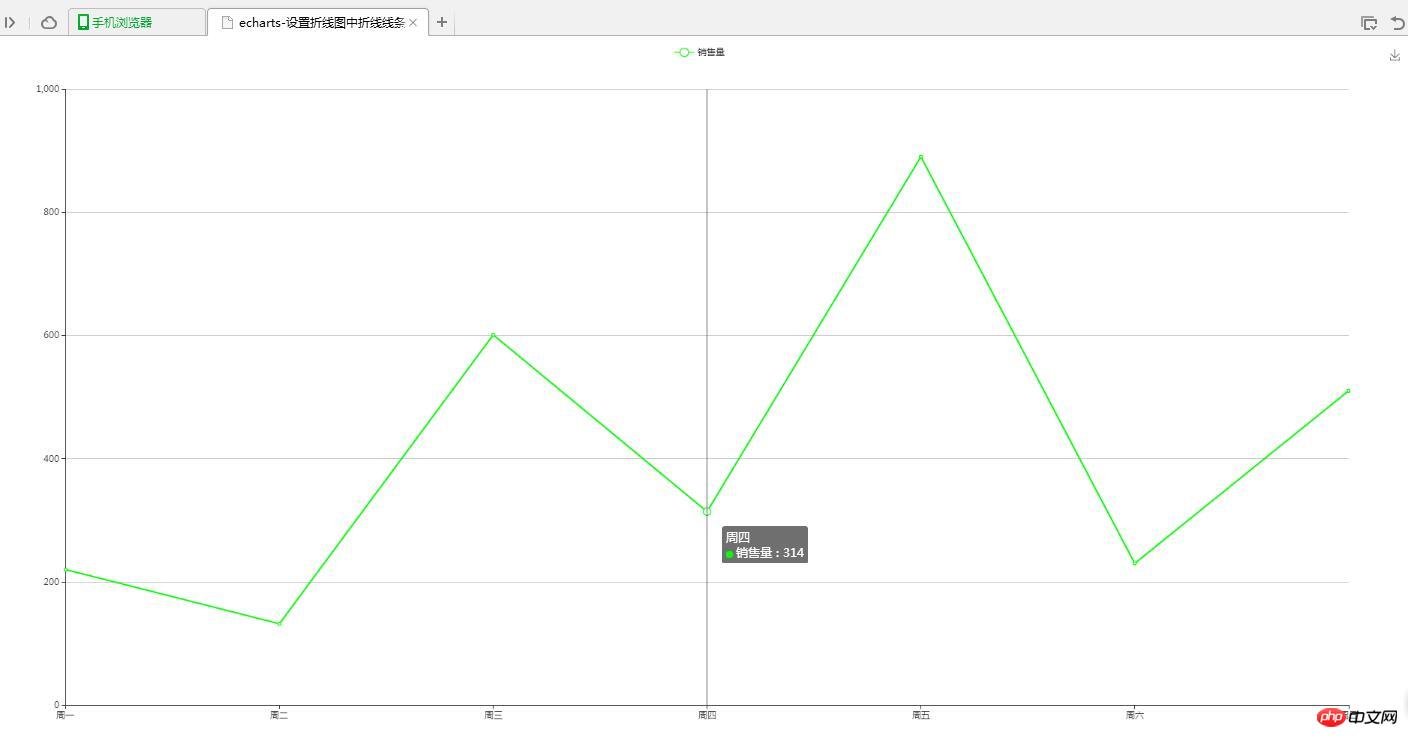
(3) 정점 사용자 정의 색상

4. 문제 설명
(1) 폴리라인 선 색상 설정
lineStyle:{
color:'#00FF00'
}(2) 세트 폴리라인 정점 색상
itemStyle : {
 normal : {
  color:'#00FF00'
 }
}관련 추천:
수직 그리드 라인을 제거하기 위한 jQuery 플러그인 echarts 사용에 대한 자세한 설명
echarts로 구현된 주기적으로 생성된 그래프 효과의 예 공유
예제 공유 echarts가 X축, Y축 및 격자선 제거 효과를 구현하는 방법
위 내용은 폴리라인 라인 색상 및 폴리라인 포인트 색상을 설정하는 전자 차트의 예의 상세 내용입니다. 자세한 내용은 PHP 중국어 웹사이트의 기타 관련 기사를 참조하세요!