

html5+canvas에서 원형 차트를 동적으로 구현하는 단계에 대한 자세한 설명
이번에는 html5+canvas를 사용하여 원형 차트를 동적으로 구현하는 단계에 대해 자세히 설명하겠습니다. html5+canvas를 사용하여 원형 차트를 동적으로 구현하는 경우 주의 사항은 무엇입니까? 바라보다.
먼저 렌더링을 살펴보겠습니다
jquery와 같은 타사 라이브러리를 참조하지 않고 dom 연산 및 캔버스 기능을 사용하여 작성되었습니다.
캔버스에 그린 원은 일반적으로 속이 빈 원과 속이 빈 원으로 구분됩니다.
수요 분석을 바탕으로 우리는 원이 견고한 원이라는 것을 알고 있습니다.
1. 먼저 캔버스를 사용하여 단단한 원을 그립니다
//伪代码
var canvas = document.createElement("canvas");
var ctx = canvas.getContext('2d');
ctx.beginPath();
ctx.arc(圆心x轴坐标,圆心y轴坐标,半径,开始角,结束角);
ctx.fillStyle = 'green';
ctx.closePath();
ctx.fill();2. 다양한 색상에 따라 원형 차트를 그립니다.
//伪代码
var canvas = document.createElement("canvas");
var ctx = canvas.getContext('2d');
ctx.beginPath();
ctx.arc(圆心x轴坐标,圆心y轴坐标,半径,绿色开始角,绿色结束角);
ctx.fillStyle = 'green';
ctx.closePath();
ctx.fill();
ctx.beginPath();
ctx.arc(圆心x轴坐标,圆心y轴坐标,半径,红色开始角,红色结束角);
ctx.fillStyle = 'red';
ctx.closePath();
ctx.fill();
ctx.beginPath();
ctx.arc(圆心x轴坐标,圆心y轴坐标,半径,黄色开始角,黄色结束角);
ctx.fillStyle = 'yellow';
ctx.closePath();
ctx.fill();
ctx.beginPath();
ctx.arc(圆心x轴坐标,圆心y轴坐标,半径,紫色开始角,紫色结束角);
ctx.fillStyle = 'purple';
ctx.closePath();
ctx.fill();3. 동적으로 원형 차트를 그립니다.
일반적으로 권장되는 세 가지 방법이 있습니다. 인터넷상의 원: requestAnimationFrame, setInterval(타이밍) 및 동적 각도 계산.
여기에서는 첫 번째 requestAnimationFrame 메서드를 사용합니다.
작성 과정에서 문제를 발견했습니다. 즉, 원을 동적으로 그릴 때 원의 중심 좌표를 기준으로 그려지지 않습니다. 이 문제를 해결하려면 원을 그릴 때마다 캔버스 브러시의 좌표를 원래 원 중심의 좌표로 다시 정의해야 합니다.
<!DOCTYPE html>
<html>
<head>
<meta charset="utf-8">
<title></title>
<style>
#graph {
/* border: 1px solid black;
height: 100%;
width: 100%;
box-sizing: border-box;*/
}
</style>
</head>
<body>
<p id="circle" style="width: 500px;float: left;"></p>
</body>
</html>
<script type="text/javascript">
(function(window,undefined){
var data = [
{"product":"产品1","sales":[192.44 ,210.54 ,220.84 ,230.11 ,220.85 ,210.59 ,205.49 ,200.55 ,195.71 ,187.46 ,180.66 ,170.90]},
{"product":"产品2","sales":[122.41 ,133.16 ,145.65 ,158.00 ,164.84 ,178.62 ,185.70 ,190.13 ,195.53 ,198.88 ,204.32 ,210.91]},
{"product":"产品3","sales":[170.30 ,175.00 ,170.79 ,165.10 ,165.62 ,160.92 ,155.92 ,145.77 ,145.17 ,140.27 ,135.99 ,130.33]},
{"product":"产品4","sales":[165.64 ,170.15 ,175.10 ,185.32 ,190.90 ,190.01 ,187.05 ,183.74 ,177.24 ,181.90 ,179.54 ,175.98]}
]
var dom_circle = document.getElementById('circle');
if(dom_circle != undefined && dom_circle != null)
{
var canvas = document.createElement("canvas");
dom_circle.appendChild(canvas);
var ctx = canvas.getContext('2d');
var defaultStyle = function(Dom,canvas){
if(Dom.clientWidth <= 300)
{
canvas.width = 300;
Dom.style.overflowX = "auto";
}
else{
canvas.width = Dom.clientWidth;
}
if(Dom.clientHeight <= 300)
{
canvas.height = 300;
Dom.style.overflowY = "auto";
}
else
{
canvas.height = Dom.clientHeight;
}
//坐标轴区域
//注意,实际画折线图区域还要比这个略小一点
return {
p1:'green',
p2:'red',
p3:'yellow',
p4:'purple',
x: 0 , //坐标轴在canvas上的left坐标
y: 0 , //坐标轴在canvas上的top坐标
maxX: canvas.width , //坐标轴在canvas上的right坐标
maxY: canvas.height , //坐标轴在canvas上的bottom坐标
r:(canvas.width)/2, //起点
ry:(canvas.height)/2, //起点
cr: (canvas.width)/4, //半径
startAngle:-(1/2*Math.PI), //开始角度
endAngle:(-(1/2*Math.PI)+2*Math.PI), //结束角度
xAngle:1*(Math.PI/180) //偏移量
};
}
//画圆
var tmpAngle = -(1/2*Math.PI);
var ds = null;
var sum = data[0]['sales'][0]+data[0]['sales'][1]+data[0]['sales'][2]+data[0]['sales'][3]
var percent1 = data[0]['sales'][0]/sum * Math.PI * 2 ;
var percent2 = data[0]['sales'][1]/sum * Math.PI * 2 + percent1;
var percent3 = data[0]['sales'][2]/sum * Math.PI * 2 + percent2;
var percent4 = data[0]['sales'][3]/sum * Math.PI * 2 + percent3;
console.log(percent1);
console.log(percent2);
console.log(percent3);
console.log(percent4);
var tmpSum = 0;
var drawCircle = function(){
if(tmpAngle >= ds.endAngle)
{
return false;
}
else if(tmpAngle+ ds.xAngle > ds.endAngle)
{
tmpAngle = ds.endAngle;
}
else{
tmpAngle += ds.xAngle;
tmpSum += ds.xAngle
}
// console.log(ds.startAngle+'***'+tmpAngle);
// console.log(tmpSum);
// ctx.clearRect(ds.x,ds.y,canvas.width,canvas.height);
if(tmpSum > percent1 && tmpSum <percent2)
{
ctx.beginPath();
ctx.moveTo(ds.r,ds.ry);
ctx.arc(ds.r,ds.ry,ds.cr,ds.startAngle+percent1,tmpAngle);
ctx.fillStyle = ds.p2;
}
else if(tmpSum > percent2 && tmpSum <percent3)
{
ctx.beginPath();
ctx.moveTo(ds.r,ds.ry);
ctx.arc(ds.r,ds.ry,ds.cr,ds.startAngle+percent2,tmpAngle);
ctx.fillStyle = ds.p3;
}
else if(tmpSum > percent3 )
{
ctx.beginPath();
ctx.moveTo(ds.r,ds.ry);
ctx.arc(ds.r,ds.ry,ds.cr,ds.startAngle+percent3,tmpAngle);
ctx.fillStyle = ds.p4;
}
else{
ctx.beginPath();
ctx.moveTo(ds.r,ds.ry);
ctx.arc(ds.r,ds.ry,ds.cr,ds.startAngle,tmpAngle);
ctx.fillStyle = ds.p1;
}
ctx.closePath();
ctx.fill();
requestAnimationFrame(drawCircle);
}
this.toDraw = function(){
ds= defaultStyle(dom_circle,canvas);
// console.log(tmpAngle);
// console.log(ds.xAngle)
ctx.clearRect(ds.x,ds.y,canvas.width,canvas.height);
drawCircle();
}
this.toDraw();
var self = this;
window.onresize = function(){
self.toDraw()
}
}
})(window);
</script>이 기사의 사례를 읽으신 후 방법을 마스터하셨다고 생각합니다. 더 흥미로운 정보를 보려면 PHP 중국어 웹사이트의 다른 관련 기사를 주목하세요!
추천 도서:
H5+WebWorkers 멀티스레드 개발 및 사용법 상세 설명
H5 오프라인 애플리케이션 및 클라이언트 스토리지 사용법 상세 설명
위 내용은 html5+canvas에서 원형 차트를 동적으로 구현하는 단계에 대한 자세한 설명의 상세 내용입니다. 자세한 내용은 PHP 중국어 웹사이트의 기타 관련 기사를 참조하세요!

핫 AI 도구

Undresser.AI Undress
사실적인 누드 사진을 만들기 위한 AI 기반 앱

AI Clothes Remover
사진에서 옷을 제거하는 온라인 AI 도구입니다.

Undress AI Tool
무료로 이미지를 벗다

Clothoff.io
AI 옷 제거제

Video Face Swap
완전히 무료인 AI 얼굴 교환 도구를 사용하여 모든 비디오의 얼굴을 쉽게 바꾸세요!

인기 기사
뜨거운 도구

메모장++7.3.1
사용하기 쉬운 무료 코드 편집기

SublimeText3 중국어 버전
중국어 버전, 사용하기 매우 쉽습니다.

스튜디오 13.0.1 보내기
강력한 PHP 통합 개발 환경

드림위버 CS6
시각적 웹 개발 도구

SublimeText3 Mac 버전
신 수준의 코드 편집 소프트웨어(SublimeText3)
뜨거운 주제
 7690
7690
 15
1639
14
1393
52
1287
25
1229
29
15
1639
14
1393
52
1287
25
1229
29

 iPhone에서 Google 지도를 기본 지도로 설정하는 방법
Apr 17, 2024 pm 07:34 PM
iPhone에서 Google 지도를 기본 지도로 설정하는 방법
Apr 17, 2024 pm 07:34 PM
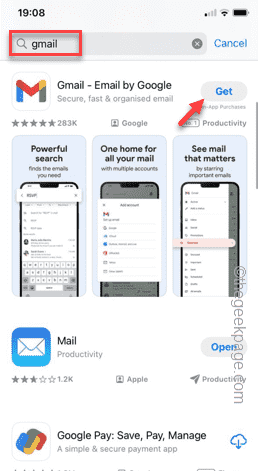
iPhone의 기본 지도는 Apple의 독점 위치 정보 제공업체인 지도입니다. 지도가 점점 좋아지고 있지만 미국 이외의 지역에서는 잘 작동하지 않습니다. Google 지도와 비교하면 아무것도 제공할 수 없습니다. 이 기사에서는 Google 지도를 사용하여 iPhone의 기본 지도로 만드는 실행 가능한 단계에 대해 설명합니다. iPhone에서 Google 지도를 기본 지도로 설정하는 방법 Google 지도를 휴대전화의 기본 지도 앱으로 설정하는 것은 생각보다 쉽습니다. 아래 단계를 따르십시오. – 전제 조건 단계 – 휴대폰에 Gmail이 설치되어 있어야 합니다. 1단계 – AppStore를 엽니다. 2단계 – “Gmail”을 검색하세요. 3단계 - Gmail 앱 옆을 클릭하세요.
 최신 버전의 WeChat으로 업그레이드하는 단계(최신 버전의 WeChat으로 업그레이드하는 방법을 쉽게 익히세요)
Jun 01, 2024 pm 10:24 PM
최신 버전의 WeChat으로 업그레이드하는 단계(최신 버전의 WeChat으로 업그레이드하는 방법을 쉽게 익히세요)
Jun 01, 2024 pm 10:24 PM
WeChat은 더 나은 사용자 경험을 제공하기 위해 지속적으로 새 버전을 출시하는 중국의 소셜 미디어 플랫폼 중 하나입니다. WeChat을 최신 버전으로 업그레이드하는 것은 가족 및 동료와 연락을 유지하고 친구와 연락을 유지하며 최신 개발 상황을 파악하는 데 매우 중요합니다. 1. 최신 버전의 기능과 개선 사항을 이해합니다. WeChat을 업그레이드하기 전에 최신 버전의 기능과 개선 사항을 이해하는 것이 매우 중요합니다. 성능 개선 및 버그 수정에 대해서는 WeChat 공식 웹사이트나 앱 스토어에서 업데이트 노트를 확인하여 새 버전에서 제공되는 다양한 새로운 기능에 대해 알아볼 수 있습니다. 2. 현재 WeChat 버전 확인 WeChat을 업그레이드하기 전에 현재 휴대폰에 설치된 WeChat 버전을 확인해야 합니다. WeChat 애플리케이션 "나"를 클릭하여 연 다음 "정보" 메뉴를 선택하면 현재 WeChat 버전 번호를 볼 수 있습니다. 3. 앱을 엽니다
 이 Apple ID는 iTunes Store에서 아직 사용되지 않습니다. 수정
Jun 10, 2024 pm 05:42 PM
이 Apple ID는 iTunes Store에서 아직 사용되지 않습니다. 수정
Jun 10, 2024 pm 05:42 PM
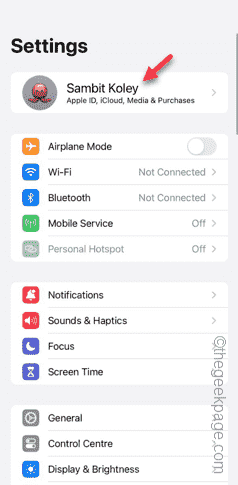
AppleID를 사용하여 iTunesStore에 로그인하면 "이 AppleID는 iTunesStore에서 사용되지 않았습니다"라는 오류가 화면에 표시될 수 있습니다. 걱정할 오류 메시지는 없습니다. 다음 솔루션 세트에 따라 문제를 해결할 수 있습니다. 수정 1 – 배송 주소 변경 iTunes Store에 이 메시지가 나타나는 주된 이유는 AppleID 프로필에 올바른 주소가 없기 때문입니다. 1단계 – 먼저 iPhone에서 iPhone 설정을 엽니다. 2단계 – AppleID는 다른 모든 설정보다 우선해야 합니다. 그러니 열어보세요. 3단계 – 거기에서 “결제 및 배송” 옵션을 엽니다. 4단계 – Face ID를 사용하여 액세스 권한을 확인하세요. 단계
 WeChat 비디오 계정을 폐쇄하는 방법은 무엇입니까? WeChat 비디오 계정 폐쇄를 위한 세부 단계
Jan 02, 2024 pm 11:57 PM
WeChat 비디오 계정을 폐쇄하는 방법은 무엇입니까? WeChat 비디오 계정 폐쇄를 위한 세부 단계
Jan 02, 2024 pm 11:57 PM
WeChat 비디오 계정을 폐쇄하는 방법을 이해하려면 먼저 채팅 소프트웨어인 WeChat에 기능이 매우 풍부하다는 것을 알아야 합니다. WeChat 비디오 계정은 사람들마다 다른 기능을 가지고 있습니다. 일반 사람들에게 위챗 동영상 계정은 개인이 촬영한 짧은 동영상을 공유하는 채널일 뿐이며 흥미로운 위챗 동영상을 공유할 수 있습니다. 다른 사람들은 WeChat 비디오 계정을 사용하여 트래픽을 유도합니다. 당연히 그들은 트롤과 트롤의 댓글을 받아들이지 못할 수도 있으므로 WeChat 비디오 계정을 폐쇄하고 싶을 수도 있습니다. 다음으로, 이 사이트의 편집자가 WeChat 비디오 계정을 폐쇄하는 방법을 소개할 것입니다. 관심 있는 친구들은 와서 살펴보세요. WeChat 비디오 계정을 폐쇄하는 단계는 다음과 같습니다. 먼저 WeChat을 열고 메인에 들어갑니다. 페이지에서 "I" 버튼을 클릭하면 다음 페이지로 이동합니다.
 iPhone에서 Shazam 앱이 작동하지 않음: 수정
Jun 08, 2024 pm 12:36 PM
iPhone에서 Shazam 앱이 작동하지 않음: 수정
Jun 08, 2024 pm 12:36 PM
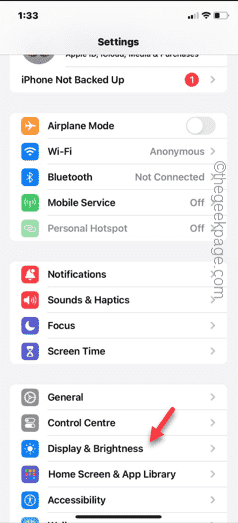
iPhone의 Shazam 앱에 문제가 있나요? Shazam은 노래를 듣고 노래를 찾는 데 도움을 줍니다. 하지만 Shazam이 제대로 작동하지 않거나 노래를 인식하지 못하는 경우 수동으로 문제를 해결해야 합니다. Shazam 앱을 복구하는 데 시간이 오래 걸리지 않습니다. 따라서 더 이상 시간을 낭비하지 않고 아래 단계에 따라 Shazam 앱 문제를 해결하세요. 수정 1 – 굵은 텍스트 기능 비활성화 iPhone의 굵은 텍스트로 인해 Shazam이 제대로 작동하지 않을 수 있습니다. 1단계 – iPhone 설정에서만 이 작업을 수행할 수 있습니다. 그러니 열어보세요. 2단계 – 다음으로 "디스플레이 및 밝기" 설정을 엽니다. 3단계 - "굵은 텍스트"가 활성화된 경우
 Win11 시스템 관리자 권한을 얻는 단계에 대한 자세한 설명
Mar 08, 2024 pm 09:09 PM
Win11 시스템 관리자 권한을 얻는 단계에 대한 자세한 설명
Mar 08, 2024 pm 09:09 PM
Windows 11은 Microsoft가 출시한 최신 운영체제로 사용자들에게 큰 사랑을 받고 있습니다. Windows 11을 사용하는 과정에서 권한이 필요한 일부 작업을 수행하기 위해 시스템 관리자 권한을 얻어야 하는 경우가 있습니다. 다음으로 Windows 11에서 시스템 관리자 권한을 얻는 단계를 자세히 소개하겠습니다. 첫 번째 단계는 "시작 메뉴"를 클릭하는 것입니다. 왼쪽 하단에 있는 Windows 아이콘을 클릭하여 "시작 메뉴"를 엽니다. 두 번째 단계에서 '를 찾아서 클릭하세요.
 iPhone 스크린샷이 작동하지 않음: 해결 방법
May 03, 2024 pm 09:16 PM
iPhone 스크린샷이 작동하지 않음: 해결 방법
May 03, 2024 pm 09:16 PM
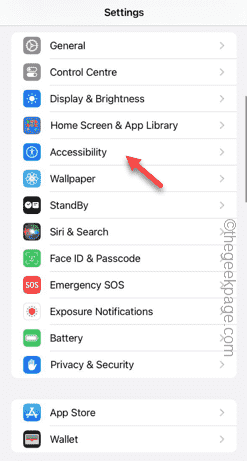
iPhone에서 스크린샷 기능이 작동하지 않나요? 스크린샷을 찍는 것은 매우 쉽습니다. 볼륨 높이기 버튼과 전원 버튼을 동시에 누르고 휴대폰 화면을 잡기만 하면 됩니다. 그러나 장치에서 프레임을 캡처하는 다른 방법이 있습니다. 수정 1 – 보조 터치 사용 보조 터치 기능을 사용하여 스크린샷을 찍습니다. 1단계 – 휴대폰 설정으로 이동합니다. 2단계 – 다음으로 탭하여 접근성 설정을 엽니다. 3단계 – 터치 설정을 엽니다. 4단계 – 다음으로 보조 터치 설정을 엽니다. 5단계 – 휴대폰에서 Assistive Touch를 켜세요. 6단계 – “상위 메뉴 사용자화”를 열어서 접근하세요. 7단계 – 이제 이러한 기능 중 하나를 화면 캡처에 연결하기만 하면 됩니다. 그러니 첫 번째를 클릭하세요.
 iPhone에 시계 앱이 없습니다. 해결 방법
May 03, 2024 pm 09:19 PM
iPhone에 시계 앱이 없습니다. 해결 방법
May 03, 2024 pm 09:19 PM
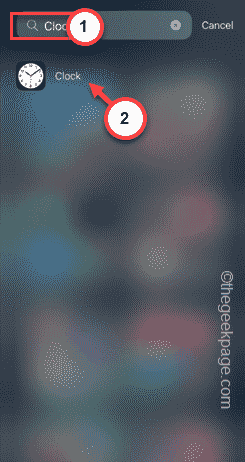
휴대폰에 시계 앱이 없나요? 날짜와 시간은 iPhone의 상태 표시줄에 계속 표시됩니다. 그러나 시계 앱이 없으면 세계 시계, 스톱워치, 알람 시계 및 기타 여러 기능을 사용할 수 없습니다. 따라서 누락된 시계 앱을 수정하는 것이 해야 할 일 목록의 맨 위에 있어야 합니다. 이러한 솔루션은 이 문제를 해결하는 데 도움이 될 수 있습니다. 수정 1 - 시계 앱 배치 실수로 홈 화면에서 시계 앱을 제거한 경우 시계 앱을 다시 제자리에 배치할 수 있습니다. 1단계 – iPhone을 잠금 해제하고 앱 라이브러리 페이지에 도달할 때까지 왼쪽으로 스와이프합니다. 2단계 – 다음으로 검색창에 “시계”를 검색하세요. 3단계 – 검색 결과 아래에 “시계”가 표시되면 길게 누르고
